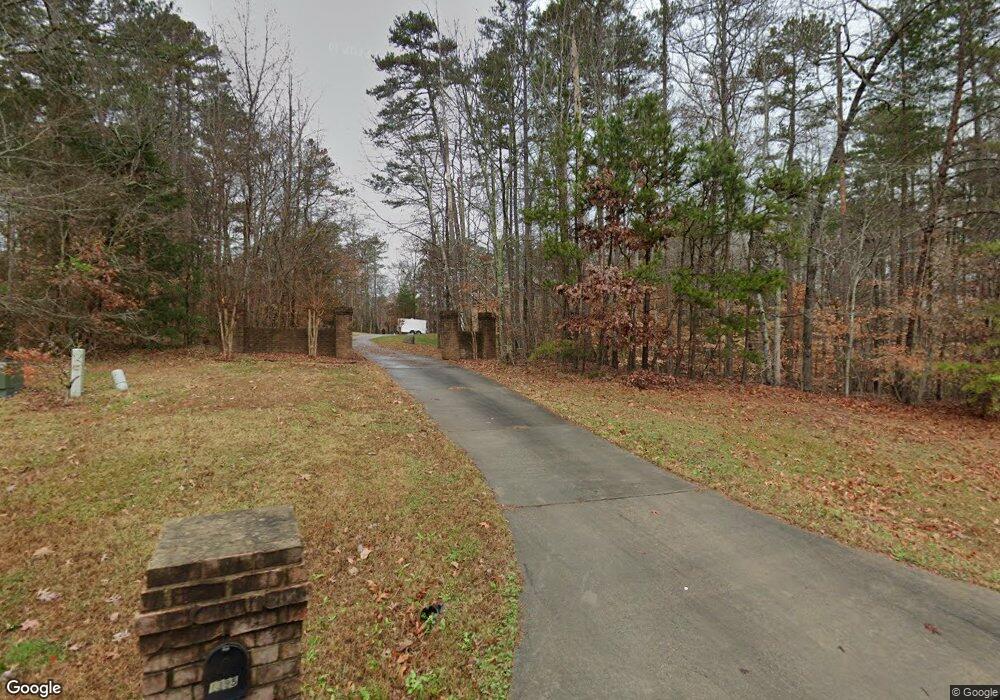
1395 Whispering Oaks Cir Matthews, NC 28104
Estimated Value: $1,008,587 - $1,306,000
4
Beds
4
Baths
3,725
Sq Ft
$298/Sq Ft
Est. Value
About This Home
This home is located at 1395 Whispering Oaks Cir, Matthews, NC 28104 and is currently estimated at $1,111,647, approximately $298 per square foot. 1395 Whispering Oaks Cir is a home located in Union County with nearby schools including Weddington Elementary School, Weddington Middle School, and Weddington High School.
Ownership History
Date
Name
Owned For
Owner Type
Purchase Details
Closed on
May 2, 2007
Sold by
Trinity Group Construction Llc
Bought by
Howie Edward
Current Estimated Value
Home Financials for this Owner
Home Financials are based on the most recent Mortgage that was taken out on this home.
Original Mortgage
$505,000
Outstanding Balance
$306,001
Interest Rate
6.1%
Mortgage Type
Purchase Money Mortgage
Estimated Equity
$805,646
Purchase Details
Closed on
Apr 26, 2006
Sold by
Mcneish Scott C
Bought by
Trinity Group Construction Llc
Home Financials for this Owner
Home Financials are based on the most recent Mortgage that was taken out on this home.
Original Mortgage
$200,000
Interest Rate
6.31%
Mortgage Type
Construction
Purchase Details
Closed on
Feb 24, 2006
Sold by
Lake Providence Properties Inc
Bought by
Mcneish Scott C
Purchase Details
Closed on
Nov 10, 1998
Sold by
Mcneish David W C and Mcneish Scott C
Bought by
Mcneish Scott C
Create a Home Valuation Report for This Property
The Home Valuation Report is an in-depth analysis detailing your home's value as well as a comparison with similar homes in the area
Home Values in the Area
Average Home Value in this Area
Purchase History
| Date | Buyer | Sale Price | Title Company |
|---|---|---|---|
| Howie Edward | -- | None Available | |
| Trinity Group Construction Llc | $193,000 | None Available | |
| Mcneish Scott C | -- | None Available | |
| Mcneish Scott C | -- | -- |
Source: Public Records
Mortgage History
| Date | Status | Borrower | Loan Amount |
|---|---|---|---|
| Open | Howie Edward | $505,000 | |
| Previous Owner | Trinity Group Construction Llc | $200,000 |
Source: Public Records
Tax History Compared to Growth
Tax History
| Year | Tax Paid | Tax Assessment Tax Assessment Total Assessment is a certain percentage of the fair market value that is determined by local assessors to be the total taxable value of land and additions on the property. | Land | Improvement |
|---|---|---|---|---|
| 2024 | $3,224 | $513,500 | $129,000 | $384,500 |
| 2023 | $3,212 | $513,500 | $129,000 | $384,500 |
| 2022 | $3,212 | $513,500 | $129,000 | $384,500 |
| 2021 | $3,205 | $513,500 | $129,000 | $384,500 |
| 2020 | $3,917 | $508,580 | $117,680 | $390,900 |
| 2019 | $3,897 | $508,580 | $117,680 | $390,900 |
| 2018 | $3,897 | $508,580 | $117,680 | $390,900 |
| 2017 | $4,121 | $508,600 | $117,700 | $390,900 |
| 2016 | $4,047 | $508,580 | $117,680 | $390,900 |
| 2015 | $4,093 | $508,580 | $117,680 | $390,900 |
| 2014 | $3,947 | $574,490 | $184,700 | $389,790 |
Source: Public Records
Map
Nearby Homes
- 1337 Whispering Oaks Cir
- 2013 Garden View Ln
- 3351 Beulah Church Rd
- 4022 Antioch Church Rd
- 1220 Hadley Park Ln
- 6419 Antioch Ct
- 0002 Antioch Church Rd Unit 1
- 0001 Antioch Church Rd
- 1229 Hadley Park Ln
- 2683 Beulah Church Rd
- 5041 Ancestry Cir
- 1461 Longleaf Ct
- 7324 Cobble Creek Dr
- 4816 Antioch Church Rd
- 809 Brown Creek Dr
- 1056 James Madison Dr
- 8503 Fox Bridge Dr Unit 16
- 101 Rainbow Falls Ln
- 2410 Cherrywood Ln
- Laurel (Falls) Plan at Falls at Weddington
- 1397 Whispering Oaks Cir
- 8312 Lake Providence Dr
- 1389 Whispering Oaks Cir
- 1397 Whispering Oaks Ln
- 4109 Huntington Dr
- 4115 Huntington Dr
- 8320 Lake Providence Dr
- 1329 Whispering Oaks Cir
- 1385 Whispering Oaks Cir
- 8224 Lake Providence Dr
- 1379 Whispering Oaks Cir
- 8328 Lake Providence Dr
- 8216 Lake Providence Dr
- Lot 424 Whispering Oaks Dr Unit 424
- Lt 424 Whispering Oaks Dr Unit 424
- 700 Eagle Point Ct
- 1404 Whispering Oaks Cir
- 8336 Lake Providence Dr
- 8208 Lake Providence Dr
- 4113 Huntington Dr