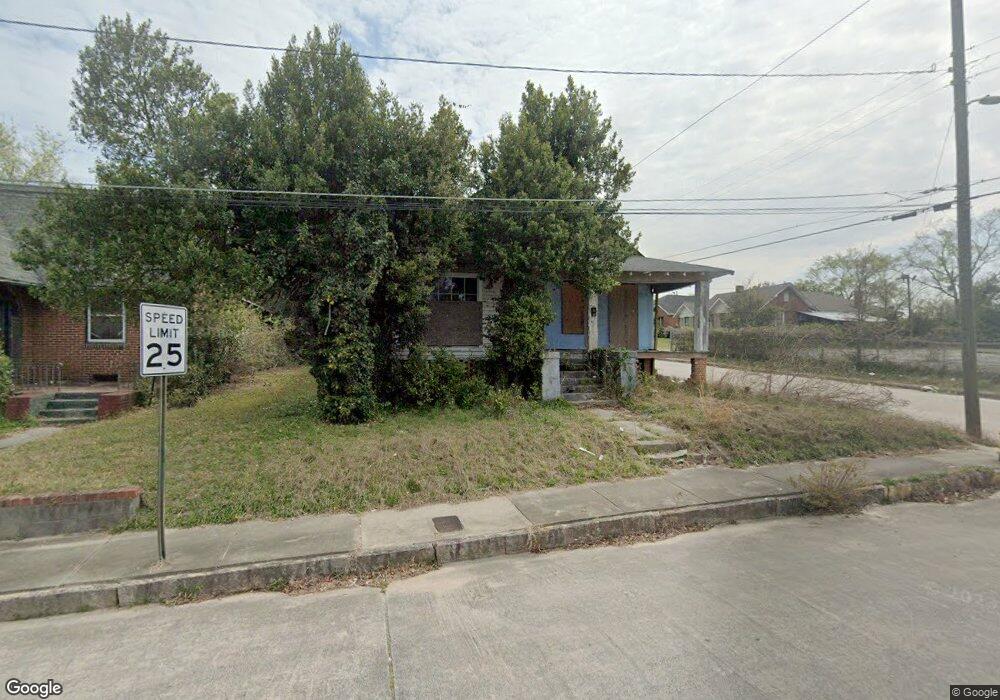
1396 Hillyer Ave Macon, GA 31204
Napier Heights Historic District NeighborhoodEstimated Value: $56,438 - $95,000
4
Beds
1
Bath
1,996
Sq Ft
$42/Sq Ft
Est. Value
About This Home
This home is located at 1396 Hillyer Ave, Macon, GA 31204 and is currently estimated at $83,610, approximately $41 per square foot. 1396 Hillyer Ave is a home located in Bibb County with nearby schools including Brookdale Elementary School, Miller Fine Arts Magnet Middle School, and Central High School.
Ownership History
Date
Name
Owned For
Owner Type
Purchase Details
Closed on
Jul 28, 2017
Sold by
Hassan Khadijah
Bought by
Coquerel Properties Llc
Current Estimated Value
Purchase Details
Closed on
Jul 27, 2011
Sold by
Moise Nicole
Bought by
Hassan Khadijah
Purchase Details
Closed on
Apr 7, 2008
Sold by
Kavuma Stanley
Bought by
Moise Nicole
Purchase Details
Closed on
Jun 1, 2007
Sold by
Kabuye Flex
Bought by
Kavuma Stanley
Home Financials for this Owner
Home Financials are based on the most recent Mortgage that was taken out on this home.
Original Mortgage
$15,000
Interest Rate
6.12%
Mortgage Type
Unknown
Purchase Details
Closed on
Oct 3, 2006
Bought by
Security Bank Of Houston Co
Purchase Details
Closed on
Nov 16, 2004
Create a Home Valuation Report for This Property
The Home Valuation Report is an in-depth analysis detailing your home's value as well as a comparison with similar homes in the area
Home Values in the Area
Average Home Value in this Area
Purchase History
We collect this data history from publicly available records. To have your information removed, we recommend requesting removal directly through your county’s website.
| Date | Buyer | Sale Price | Title Company |
|---|---|---|---|
| Coquerel Properties Llc | $5,500 | None Available | |
| Hassan Khadijah | $2,000 | None Available | |
| Moise Nicole | $17,000 | None Available | |
| Kavuma Stanley | -- | None Available | |
| Security Bank Of Houston Co | $24,700 | -- | |
| -- | -- | -- | |
| -- | $17,000 | -- |
Source: Public Records
Mortgage History
We collect this data history from publicly available records. To have your information removed, we recommend requesting removal directly through your county’s website.
| Date | Status | Borrower | Loan Amount |
|---|---|---|---|
| Previous Owner | Kavuma Stanley | $15,000 |
Source: Public Records
Tax History
| Year | Tax Paid | Tax Assessment Tax Assessment Total Assessment is a certain percentage of the fair market value that is determined by local assessors to be the total taxable value of land and additions on the property. | Land | Improvement |
|---|---|---|---|---|
| 2025 | $215 | $8,758 | $2,760 | $5,998 |
| 2024 | $222 | $8,758 | $2,760 | $5,998 |
| 2023 | $217 | $7,325 | $1,660 | $5,665 |
| 2022 | $138 | $3,985 | $2,211 | $1,774 |
| 2021 | $147 | $3,862 | $2,211 | $1,651 |
| 2020 | $145 | $3,740 | $2,211 | $1,529 |
| 2019 | $133 | $4,399 | $2,457 | $1,942 |
| 2018 | $132 | $5,909 | $2,457 | $3,452 |
| 2017 | $221 | $5,909 | $2,457 | $3,452 |
| 2016 | $204 | $5,908 | $2,457 | $3,452 |
| 2015 | $289 | $5,908 | $2,457 | $3,452 |
| 2014 | $333 | $5,908 | $2,457 | $3,452 |
Source: Public Records
Map
Nearby Homes
- 1396 Courtland Ave
- 1282 Courtland Ave
- 1285 Pio Nono Ave
- 1290 Pio Nono Ave
- 1487 Brentwood Ave
- 1568 Marigold Ave
- 2833 Elpis St
- 1195 Brentwood Ave
- 1597 Cedar Ave
- 340 Poppy Ave
- 1061 Hillyer Ave
- 1036 Hillyer Ave
- 1076 Crescent Ave
- 2877 Ellis South Evans State Road St
- 2485 Beech Ave
- 2702 Cherokee Ave
- 2592 Montpelier Ave
- 1470 Bankston Ave
- 2372 Beech Ave
- 1463 Bankston Ave
- 1384 Hillyer Ave
- 1372 Hillyer Ave
- 1397 Hillyer Ave
- 1385 Hillyer Ave
- 1360 Hillyer Ave
- 2680 Cherry Ave
- 2680/82 Cherry Ave
- 1373 Hillyer Ave
- 1361 Hillyer Ave
- 1348 Hillyer Ave
- 2670 Cherry Ave
- 2663 Cherry Ave
- 1349 Hillyer Ave
- 1336 Hillyer Ave
- 138 Churchill St
- 2664 Cherry Ave
- 2729 Cherry Ave
- 1337 Hillyer Ave
- 1355 Courtland Ave
- 2679 Montpelier Ave
Your Personal Tour Guide
Ask me questions while you tour the home.