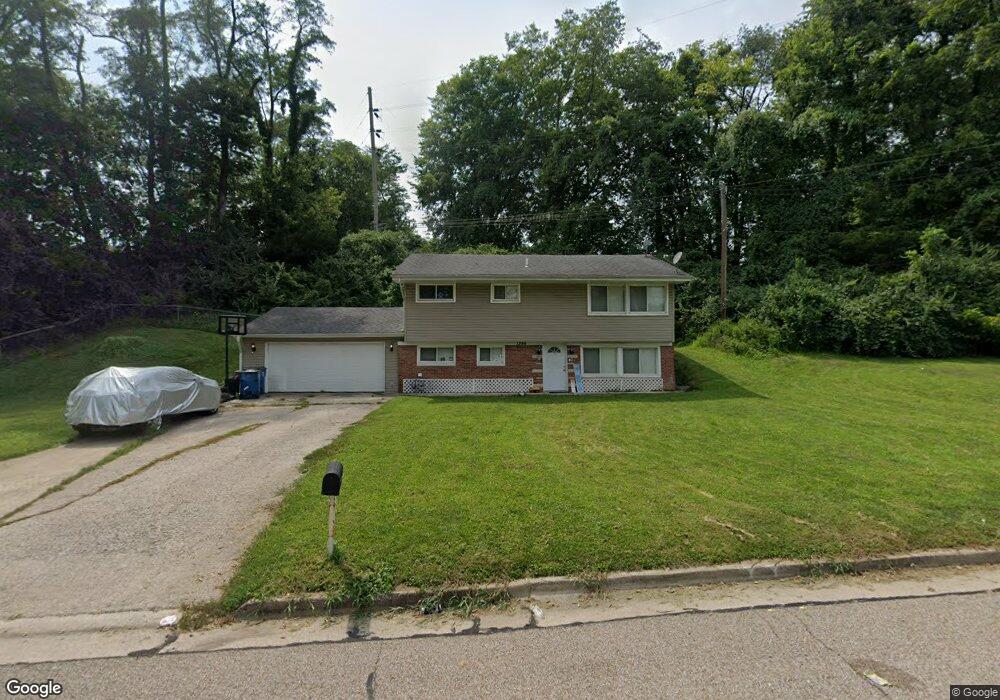
1396 N Keebler Ave Collinsville, IL 62234
Estimated Value: $148,000 - $202,000
2
Beds
2
Baths
900
Sq Ft
$189/Sq Ft
Est. Value
About This Home
This home is located at 1396 N Keebler Ave, Collinsville, IL 62234 and is currently estimated at $170,347, approximately $189 per square foot. 1396 N Keebler Ave is a home located in Madison County with nearby schools including John A Renfro Elementary School, Dorris Intermediate School, and Collinsville Middle School.
Ownership History
Date
Name
Owned For
Owner Type
Purchase Details
Closed on
Jul 21, 2010
Sold by
The Bank Of New York Mellon
Bought by
Astrauskas Linda and Astrauskas Mary
Current Estimated Value
Purchase Details
Closed on
Oct 20, 2009
Sold by
Munoz Jose L
Bought by
The Bank Of New York Mellon and The Bank Of New York
Purchase Details
Closed on
Apr 10, 2006
Sold by
Hartmann Douglas
Bought by
Munoz Jose
Home Financials for this Owner
Home Financials are based on the most recent Mortgage that was taken out on this home.
Original Mortgage
$132,500
Interest Rate
8.65%
Mortgage Type
Fannie Mae Freddie Mac
Purchase Details
Closed on
Sep 2, 2005
Sold by
Garloch Erin R and Garloch David M
Bought by
Hartmann Douglas
Home Financials for this Owner
Home Financials are based on the most recent Mortgage that was taken out on this home.
Original Mortgage
$80,550
Interest Rate
6.85%
Mortgage Type
Unknown
Create a Home Valuation Report for This Property
The Home Valuation Report is an in-depth analysis detailing your home's value as well as a comparison with similar homes in the area
Home Values in the Area
Average Home Value in this Area
Purchase History
| Date | Buyer | Sale Price | Title Company |
|---|---|---|---|
| Astrauskas Linda | $56,000 | Fatic | |
| The Bank Of New York Mellon | -- | None Available | |
| Munoz Jose | $132,500 | Abstracts & Titles Inc | |
| Hartmann Douglas | $57,500 | Abstracts & Titles Inc |
Source: Public Records
Mortgage History
| Date | Status | Borrower | Loan Amount |
|---|---|---|---|
| Previous Owner | Munoz Jose | $132,500 | |
| Previous Owner | Hartmann Douglas | $80,550 |
Source: Public Records
Tax History Compared to Growth
Tax History
| Year | Tax Paid | Tax Assessment Tax Assessment Total Assessment is a certain percentage of the fair market value that is determined by local assessors to be the total taxable value of land and additions on the property. | Land | Improvement |
|---|---|---|---|---|
| 2024 | $3,097 | $48,450 | $13,130 | $35,320 |
| 2023 | $3,097 | $44,840 | $12,150 | $32,690 |
| 2022 | $2,951 | $41,470 | $11,240 | $30,230 |
| 2021 | $2,805 | $40,610 | $11,070 | $29,540 |
| 2020 | $2,704 | $38,740 | $10,560 | $28,180 |
| 2019 | $2,633 | $37,420 | $10,200 | $27,220 |
| 2018 | $2,573 | $35,440 | $9,660 | $25,780 |
| 2017 | $2,578 | $34,740 | $9,470 | $25,270 |
| 2016 | $2,715 | $34,740 | $9,470 | $25,270 |
| 2015 | $1,382 | $35,030 | $10,920 | $24,110 |
| 2014 | $1,382 | $18,460 | $10,920 | $7,540 |
| 2013 | $1,382 | $18,460 | $10,920 | $7,540 |
Source: Public Records
Map
Nearby Homes
- 203 Greenfield Dr
- 0 N Keebler Ave
- 1224 Cedar Ridge Ct
- 1120 Williams St
- 1210 Constance St
- 414 Bunker Hill Dr
- 308 Brown Ave
- 22 Brookwood Dr
- 5 Brookwood Dr
- 617 N Morrison Ave
- 706 Illinois Ave
- 501 Spring
- 1227 Ridge Ave
- 10 White Lily Dr
- 123 W Wickliffe Ave
- 102 Toni Ct
- 0 Strong Ave
- 123 Elliot St
- 919 Vine St
- 921 Prospect St
- 1303 N Keebler Ave
- 830 Kneedler St
- 1301 N Keebler Ave
- 841 Victory Dr
- 1269 N Keebler Ave
- 1336 Theodore Ave
- 828 Kneedler St
- 839 Victory Dr
- 1300 N Keebler Ave
- 1398 N Keebler Ave
- 1334 Theodore Ave
- 1263 N Keebler Ave
- 837 Victory Dr
- 827 Kneedler St
- 1332 Theodore Ave
- 827 Kneedler St
- 1400 N Keebler Ave
- 844 Victory Dr
- 1266 N Keebler Ave
- 307 Garesche St