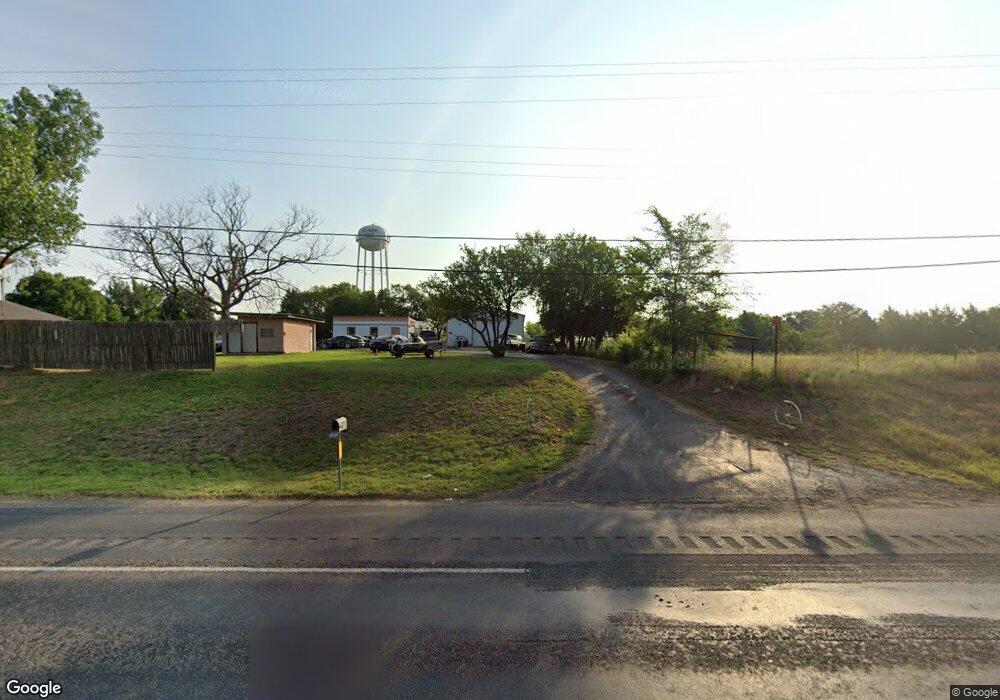
1396 Us Highway 69 Denison, TX 75021
Estimated Value: $130,016 - $205,000
--
Bed
--
Bath
1,056
Sq Ft
$159/Sq Ft
Est. Value
About This Home
This home is located at 1396 Us Highway 69, Denison, TX 75021 and is currently estimated at $167,508, approximately $158 per square foot. 1396 Us Highway 69 is a home located in Grayson County with nearby schools including Lamar Elementary School, Scott Middle School, and Denison High School.
Ownership History
Date
Name
Owned For
Owner Type
Purchase Details
Closed on
Aug 5, 2025
Sold by
Mckeon Tressie E
Bought by
Dr Home Solutions Llc
Current Estimated Value
Purchase Details
Closed on
Dec 23, 2024
Sold by
Dr Home Solutions Llc
Bought by
Collier Eric and Benge Eric
Home Financials for this Owner
Home Financials are based on the most recent Mortgage that was taken out on this home.
Original Mortgage
$62,500
Interest Rate
6.79%
Mortgage Type
New Conventional
Purchase Details
Closed on
Jun 10, 2024
Sold by
Cartagena Daniel
Bought by
Dr Home Solutions Llc
Purchase Details
Closed on
Dec 8, 2021
Sold by
Ridenour Billy and Ridenour Lana
Bought by
Cartagena Daniel
Home Financials for this Owner
Home Financials are based on the most recent Mortgage that was taken out on this home.
Original Mortgage
$60,000
Interest Rate
3.14%
Mortgage Type
Purchase Money Mortgage
Purchase Details
Closed on
Sep 28, 2018
Sold by
Leake Ethel
Bought by
Ridenour Billy
Create a Home Valuation Report for This Property
The Home Valuation Report is an in-depth analysis detailing your home's value as well as a comparison with similar homes in the area
Home Values in the Area
Average Home Value in this Area
Purchase History
| Date | Buyer | Sale Price | Title Company |
|---|---|---|---|
| Dr Home Solutions Llc | $69,669 | None Listed On Document | |
| Collier Eric | -- | Red River Title | |
| Collier Eric | -- | Red River Title | |
| Dr Home Solutions Llc | -- | Red River Title | |
| Cartagena Daniel | -- | Grayson County Title | |
| Ridenour Billy | -- | None Available |
Source: Public Records
Mortgage History
| Date | Status | Borrower | Loan Amount |
|---|---|---|---|
| Previous Owner | Collier Eric | $62,500 | |
| Previous Owner | Cartagena Daniel | $60,000 |
Source: Public Records
Tax History Compared to Growth
Tax History
| Year | Tax Paid | Tax Assessment Tax Assessment Total Assessment is a certain percentage of the fair market value that is determined by local assessors to be the total taxable value of land and additions on the property. | Land | Improvement |
|---|---|---|---|---|
| 2025 | $446 | $29,304 | $17,610 | $11,694 |
| 2024 | $446 | $27,596 | $16,400 | $11,196 |
| 2023 | $507 | $31,341 | $16,400 | $14,941 |
| 2022 | $503 | $29,082 | $12,300 | $16,782 |
| 2021 | $410 | $21,889 | $7,073 | $14,816 |
| 2020 | $474 | $23,815 | $7,073 | $16,742 |
| 2019 | $508 | $23,917 | $7,073 | $16,844 |
| 2018 | $669 | $31,170 | $6,300 | $24,870 |
| 2017 | $623 | $28,860 | $6,300 | $22,560 |
| 2016 | $546 | $25,260 | $6,300 | $18,960 |
| 2015 | $525 | $24,118 | $4,200 | $19,918 |
| 2014 | $478 | $21,931 | $3,847 | $18,084 |
Source: Public Records
Map
Nearby Homes
- TBD N Highway 69
- 21 Chaparral Estates Dr
- 732 E Bullock St
- 721 E Bullock St
- 715 E Hanna St
- 705 E Hanna St
- 1534 E Texas St
- 621 E Murray St
- 417 E Texas St
- 54 Doty Ln
- 622 E Heron St
- 1513 Desvoignes Rd
- 230 Frosty Hollow Rd
- 1506 S Travis St
- TBD Bells Dr
- 609 E Monterey St
- 1905 S Lamar Ave
- 1903 S Lamar Ave
- 1901 S Lamar Ave
- TBD E Heron St
- 1391 Us Highway 69
- 1382 Us Highway 69
- 1421 Us Highway 69
- 1452 Us Highway 69
- 1336 Hwy 69
- 1335 Us Highway 69
- 1477 Us Highway 69
- 1330 Us Highway 69
- 1394 Us Highway 69
- 1441 U S 69
- 1441 Us Highway 69
- 177 Snow Rd
- 377 Snow Rd
- 329 Snow Rd
- 1600 E Us Highway 69
- 139 Snow Rd
- 439 Snow Rd
- 00 Snow Rd
- 310 Snow Rd
- 1646 Us Highway 69