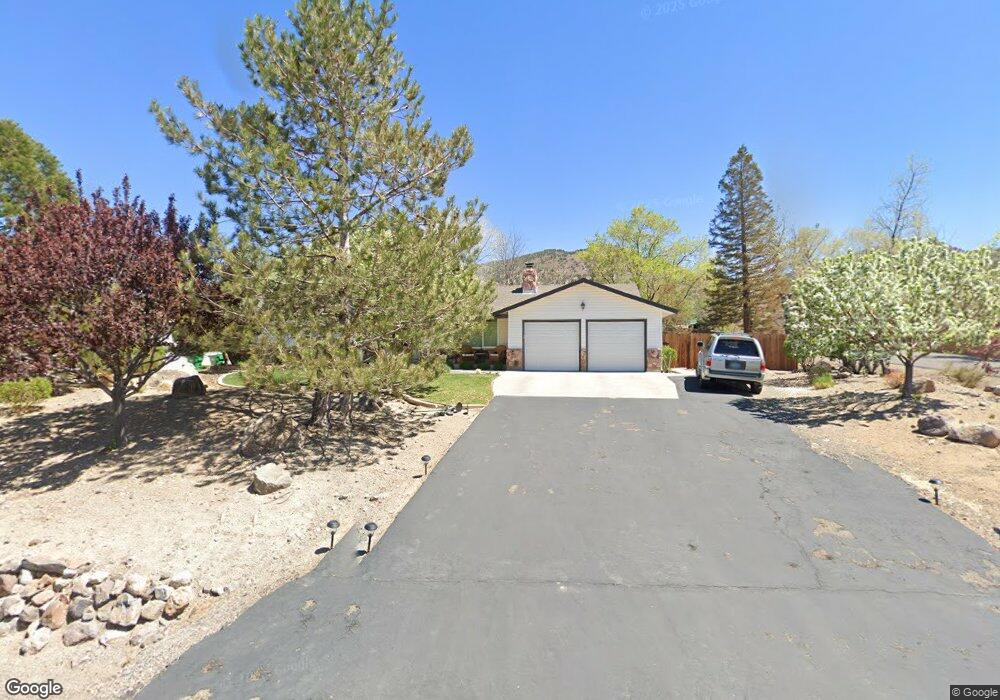
13960 Chamy Dr Reno, NV 89521
Virginia Foothills NeighborhoodEstimated Value: $526,462 - $631,000
3
Beds
2
Baths
1,572
Sq Ft
$369/Sq Ft
Est. Value
About This Home
This home is located at 13960 Chamy Dr, Reno, NV 89521 and is currently estimated at $580,616, approximately $369 per square foot. 13960 Chamy Dr is a home located in Washoe County with nearby schools including Brown Elementary School, Marce Herz Middle School, and Galena High School.
Ownership History
Date
Name
Owned For
Owner Type
Purchase Details
Closed on
Dec 13, 2024
Sold by
Ritchie Lara
Bought by
Bushman Ritchie Trust and Bushman
Current Estimated Value
Purchase Details
Closed on
Oct 14, 2019
Sold by
Ritchie Lara and Bushman Jay
Bought by
Ritchie Lara
Home Financials for this Owner
Home Financials are based on the most recent Mortgage that was taken out on this home.
Original Mortgage
$241,585
Interest Rate
3.4%
Mortgage Type
Commercial
Purchase Details
Closed on
Oct 21, 2004
Sold by
Mcguffey Laverne L
Bought by
Ritchie Lara
Home Financials for this Owner
Home Financials are based on the most recent Mortgage that was taken out on this home.
Original Mortgage
$225,000
Interest Rate
1%
Mortgage Type
Negative Amortization
Purchase Details
Closed on
Oct 2, 1998
Sold by
Lahti Victor M
Bought by
Lahti Victor M and Happoja Lahti Living Trust
Create a Home Valuation Report for This Property
The Home Valuation Report is an in-depth analysis detailing your home's value as well as a comparison with similar homes in the area
Home Values in the Area
Average Home Value in this Area
Purchase History
| Date | Buyer | Sale Price | Title Company |
|---|---|---|---|
| Bushman Ritchie Trust | -- | None Listed On Document | |
| Bushman Ritchie Trust | -- | None Listed On Document | |
| Ritchie Lara | -- | None Available | |
| Ritchie Lara | $325,000 | Stewart Title Of Northern Nv | |
| Lahti Victor M | -- | -- |
Source: Public Records
Mortgage History
| Date | Status | Borrower | Loan Amount |
|---|---|---|---|
| Previous Owner | Ritchie Lara | $241,585 | |
| Previous Owner | Ritchie Lara | $225,000 |
Source: Public Records
Tax History
| Year | Tax Paid | Tax Assessment Tax Assessment Total Assessment is a certain percentage of the fair market value that is determined by local assessors to be the total taxable value of land and additions on the property. | Land | Improvement |
|---|---|---|---|---|
| 2026 | -- | $77,617 | $52,500 | $25,117 |
| 2025 | $1,151 | $77,448 | $52,500 | $24,948 |
| 2024 | $1,151 | $77,134 | $52,500 | $24,634 |
| 2023 | $1,118 | $75,256 | $52,500 | $22,756 |
| 2022 | $1,085 | $65,308 | $46,795 | $18,513 |
| 2021 | $1,053 | $49,560 | $31,535 | $18,025 |
| 2020 | $1,022 | $49,194 | $31,535 | $17,659 |
| 2019 | $989 | $43,634 | $26,880 | $16,754 |
| 2018 | $962 | $34,840 | $18,760 | $16,080 |
| 2017 | $936 | $33,364 | $17,570 | $15,794 |
| 2016 | $914 | $32,001 | $16,100 | $15,901 |
| 2015 | $227 | $31,369 | $15,610 | $15,759 |
| 2014 | $879 | $27,882 | $12,075 | $15,807 |
| 2013 | -- | $26,337 | $10,605 | $15,732 |
Source: Public Records
Map
Nearby Homes
- 0 Kenneth Way Unit 230006476
- 2982 Saddle Peak Dr
- 2978 Saddle Peak Dr
- 3036 Feathertop Dr
- 3035 Feathertop Dr
- 14490 Rancheros Dr
- 2944 Ruby Desert Dr
- 14505 Geronimo Trail
- 2945 Ruby Desert Dr
- 3034 Copper Stone Dr
- 14595 Chamy Dr
- 2976 Ruby Desert Dr
- 13510 Water Willow St
- 3028 Amethyst Hills Dr
- 0 Western Skies Dr Unit (016-730-13)
- 01672026 Western Skies Dr Unit 16-720-26
- 00 Western Skies Dr
- 14675 Chamy Dr
- 14690 Rancheros Dr
- 2712 Copper Flats Dr
- 13930 Chamy Dr Unit 4
- 14010 Chamy Dr
- 13965 Rancheros Dr
- 313 Chamy Dr
- 13890 Chamy Dr
- 13935 Rancheros Dr
- 13965 Chamy Dr
- 1630 Rim Rock Dr
- 14040 Chamy Dr
- 13935 Chamy Dr
- 13905 Rancheros Dr
- 14015 Chamy Dr
- 13870 Chamy Dr
- 13905 Chamy Dr
- 14025 Rancheros Dr
- 14045 Chamy Dr
- 14160 Chamy Dr
- 13875 Rancheros Dr
- 13875 Chamy Dr
- 14175 Rancheros Dr
Your Personal Tour Guide
Ask me questions while you tour the home.