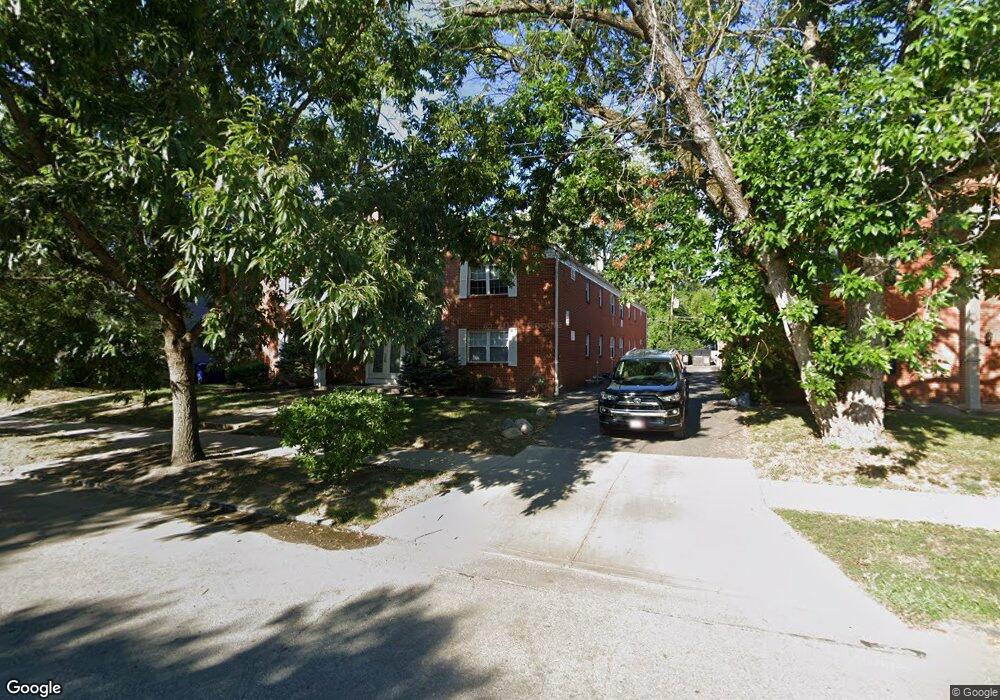
1397 Broadview Ave Columbus, OH 43212
Fifth by Northwest NeighborhoodEstimated Value: $162,000 - $182,000
1
Bed
1
Bath
575
Sq Ft
$299/Sq Ft
Est. Value
About This Home
This home is located at 1397 Broadview Ave, Columbus, OH 43212 and is currently estimated at $171,732, approximately $298 per square foot. 1397 Broadview Ave is a home located in Franklin County with nearby schools including Cranbrook Elementary School, Ridgeview Middle School, and Centennial High School.
Ownership History
Date
Name
Owned For
Owner Type
Purchase Details
Closed on
Oct 26, 2019
Sold by
Kawecki Dennis and Kawecki Lucine
Bought by
Kawecki Dennis David and Kawecki Lucine
Current Estimated Value
Purchase Details
Closed on
Apr 20, 2017
Sold by
Benadum Kathryn R and Cox Kathryn R
Bought by
Kawecki Dennis
Home Financials for this Owner
Home Financials are based on the most recent Mortgage that was taken out on this home.
Original Mortgage
$82,500
Outstanding Balance
$67,860
Interest Rate
4.14%
Mortgage Type
New Conventional
Estimated Equity
$103,872
Purchase Details
Closed on
May 14, 2007
Sold by
Broadview Avenue Llc
Bought by
Cox Kathryn R
Home Financials for this Owner
Home Financials are based on the most recent Mortgage that was taken out on this home.
Original Mortgage
$96,660
Interest Rate
6.27%
Mortgage Type
Purchase Money Mortgage
Create a Home Valuation Report for This Property
The Home Valuation Report is an in-depth analysis detailing your home's value as well as a comparison with similar homes in the area
Home Values in the Area
Average Home Value in this Area
Purchase History
| Date | Buyer | Sale Price | Title Company |
|---|---|---|---|
| Kawecki Dennis David | -- | None Available | |
| Kawecki Dennis | $120,500 | Northwest Title | |
| Cox Kathryn R | $107,400 | Esquire |
Source: Public Records
Mortgage History
| Date | Status | Borrower | Loan Amount |
|---|---|---|---|
| Open | Kawecki Dennis | $82,500 | |
| Previous Owner | Cox Kathryn R | $96,660 |
Source: Public Records
Tax History
| Year | Tax Paid | Tax Assessment Tax Assessment Total Assessment is a certain percentage of the fair market value that is determined by local assessors to be the total taxable value of land and additions on the property. | Land | Improvement |
|---|---|---|---|---|
| 2025 | $2,186 | $47,710 | $10,500 | $37,210 |
| 2024 | $2,186 | $47,710 | $10,500 | $37,210 |
| 2023 | $2,159 | $47,705 | $10,500 | $37,205 |
| 2022 | $2,054 | $38,650 | $15,230 | $23,420 |
| 2021 | $2,058 | $38,650 | $15,230 | $23,420 |
| 2020 | $2,061 | $38,650 | $15,230 | $23,420 |
| 2019 | $2,183 | $35,110 | $13,830 | $21,280 |
| 2018 | $2,009 | $35,110 | $13,830 | $21,280 |
| 2017 | $2,129 | $35,110 | $13,830 | $21,280 |
| 2016 | $2,024 | $30,560 | $5,080 | $25,480 |
| 2015 | $1,838 | $30,560 | $5,080 | $25,480 |
| 2014 | $1,842 | $30,560 | $5,080 | $25,480 |
| 2013 | $2,019 | $33,950 | $5,635 | $28,315 |
Source: Public Records
Map
Nearby Homes
- 1500 Fairview Ave
- 1424-1426 Ashland Ave
- 00 W 7th Ave
- 1661 Ashland Ave Unit 663
- 1558 Northwest Blvd
- 1566 Northwest Blvd
- 1299 Doten Ave Unit 1299
- 1297 Doten Ave
- 1523 Wyandotte Rd
- 1112 Elmwood Ave
- 1875 W 1st Ave
- 1799 Kings Ct Unit B
- 1785 Northwest Ct Unit D
- 1810 Ashland Ave
- 1835 Northwest Ct Unit 141
- 1226 Lincoln Rd
- 1000 Urlin Ave Unit 2007
- 1000 Urlin Ave Unit 520
- 1000 Urlin Ave Unit 1407
- 1000 Urlin Ave Unit 1007
- 1397 Broadview Ave Unit 3
- 1397 Broadview Ave Unit 4
- 1397 Broadview Ave Unit 7
- 1397 Broadview Ave Unit 16
- 1397 Broadview Ave
- 1397 Broadview Ave
- 1397 Broadview Ave
- 1397 Broadview Ave
- 1397 Broadview Ave
- 1397 Broadview Ave
- 1397 Broadview Ave
- 1397 Broadview Ave
- 1397 Broadview Ave Unit 8
- 1397 Broadview Ave Unit 17
- 1397 Broadview Ave Unit 14
- 1397 Broadview Ave Unit 5
- 1397 Broadview Ave Unit 11
- 1397 Broadview Ave Unit 10
- 1397 Broadview Ave Unit 6
- 1397 Broadview Ave Unit 12