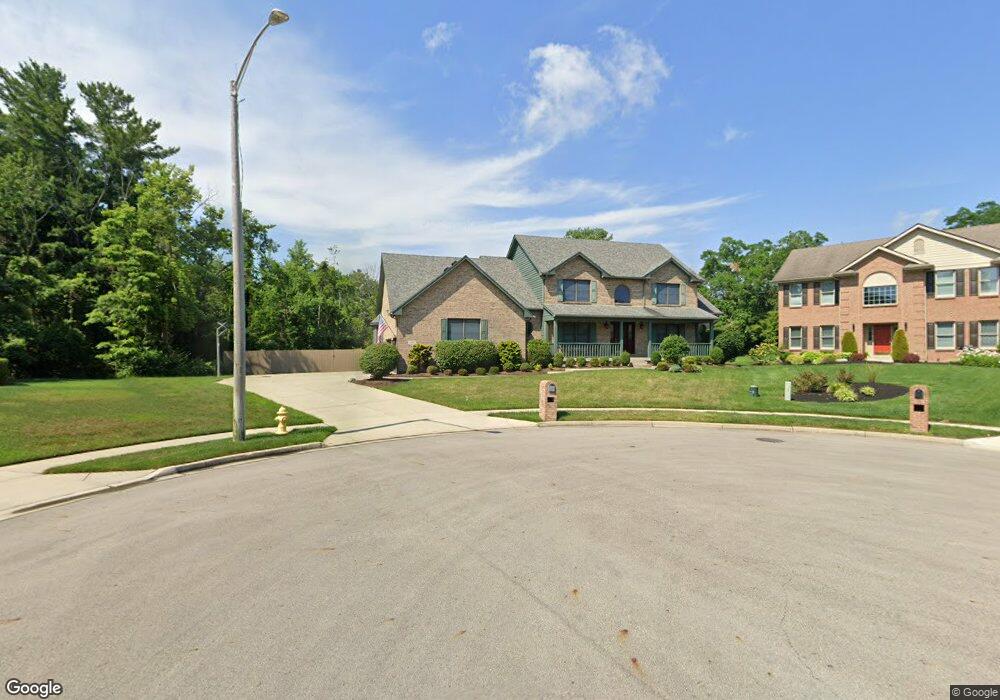
1397 Leaf Tree Ln Vandalia, OH 45377
Estimated Value: $509,000 - $590,000
4
Beds
3
Baths
3,906
Sq Ft
$139/Sq Ft
Est. Value
About This Home
This home is located at 1397 Leaf Tree Ln, Vandalia, OH 45377 and is currently estimated at $544,494, approximately $139 per square foot. 1397 Leaf Tree Ln is a home located in Montgomery County with nearby schools including Helke Elementary School, Morton Middle School, and Butler High School.
Ownership History
Date
Name
Owned For
Owner Type
Purchase Details
Closed on
Jun 11, 2004
Sold by
Elassal Sherif M and Madkour Dalia
Bought by
Keeley Kevin M and Keeley Patricia E
Current Estimated Value
Home Financials for this Owner
Home Financials are based on the most recent Mortgage that was taken out on this home.
Original Mortgage
$185,000
Interest Rate
6.17%
Mortgage Type
Purchase Money Mortgage
Purchase Details
Closed on
Jul 30, 2001
Sold by
William Miller and William Cheryl L
Bought by
Elassal Sherif M and Madkour Dalia
Home Financials for this Owner
Home Financials are based on the most recent Mortgage that was taken out on this home.
Original Mortgage
$275,000
Outstanding Balance
$102,281
Interest Rate
7.14%
Estimated Equity
$442,213
Purchase Details
Closed on
Mar 4, 1997
Sold by
Woodland Meadows Development Co Inc
Bought by
Miller William and Miller Bill H
Create a Home Valuation Report for This Property
The Home Valuation Report is an in-depth analysis detailing your home's value as well as a comparison with similar homes in the area
Home Values in the Area
Average Home Value in this Area
Purchase History
| Date | Buyer | Sale Price | Title Company |
|---|---|---|---|
| Keeley Kevin M | $385,000 | -- | |
| Elassal Sherif M | $344,000 | -- | |
| Miller William | $54,900 | -- |
Source: Public Records
Mortgage History
| Date | Status | Borrower | Loan Amount |
|---|---|---|---|
| Closed | Keeley Kevin M | $185,000 | |
| Open | Elassal Sherif M | $275,000 | |
| Closed | Elassal Sherif M | $51,800 |
Source: Public Records
Tax History
| Year | Tax Paid | Tax Assessment Tax Assessment Total Assessment is a certain percentage of the fair market value that is determined by local assessors to be the total taxable value of land and additions on the property. | Land | Improvement |
|---|---|---|---|---|
| 2025 | $8,026 | $149,410 | $24,000 | $125,410 |
| 2024 | $7,774 | $149,410 | $24,000 | $125,410 |
| 2023 | $7,774 | $149,410 | $24,000 | $125,410 |
| 2022 | $7,567 | $117,650 | $18,900 | $98,750 |
| 2021 | $7,574 | $117,650 | $18,900 | $98,750 |
| 2020 | $7,552 | $117,650 | $18,900 | $98,750 |
| 2019 | $7,382 | $105,420 | $18,900 | $86,520 |
| 2018 | $7,396 | $105,420 | $18,900 | $86,520 |
| 2017 | $7,341 | $105,420 | $18,900 | $86,520 |
| 2016 | $7,310 | $103,200 | $15,750 | $87,450 |
| 2015 | $7,219 | $103,200 | $15,750 | $87,450 |
| 2014 | $7,219 | $103,200 | $15,750 | $87,450 |
| 2012 | -- | $99,570 | $19,250 | $80,320 |
Source: Public Records
Map
Nearby Homes
- 1182 Park Forest Dr
- 76 Farrell Rd
- 246 Crest Hill Ave
- 1727 Ashworth Dr
- 1025 Helke Rd
- 416 Bent Twig Dr
- 1025 Ronald St
- 1054 Wilhelmina Dr
- 461 Poplar Grove Dr
- 1371 Cornish Dr
- 485 Pilot Point Unit 1-301
- 770 Deer Creek Dr
- 106 Grosbeck St
- 333 Bayonne Dr
- 3518 Park Crest Ln
- 905 Pool Ave
- 545 Koch Ave
- 7725 Rockwell Dr
- 465 Pilot Point Unit 1-302
- 475 Pilot Point Unit 1-300
- 1385 Leaf Tree Ln
- 1343 Leaf Tree Ln
- 1372 Leaf Tree Ln
- 264 Shadowood Dr
- 206 Shadowood Dr
- 304 Shadowood Dr
- 140 Shadowood Dr
- 1348 Leaf Tree Ln
- 110 Shadowood Dr
- 320 Shadowood Dr
- 1324 Leaf Tree Ln
- 1300 Leaf Tree Ln
- 334 Shadowood Dr
- 205 Shadowood Dr
- 111 Shadowood Dr
- 333 Woodland Meadows Dr
- 301 Shadowood Dr
- 181 Shadowood Dr
- 1290 Leaf Tree Ln
- 141 Shadowood Dr