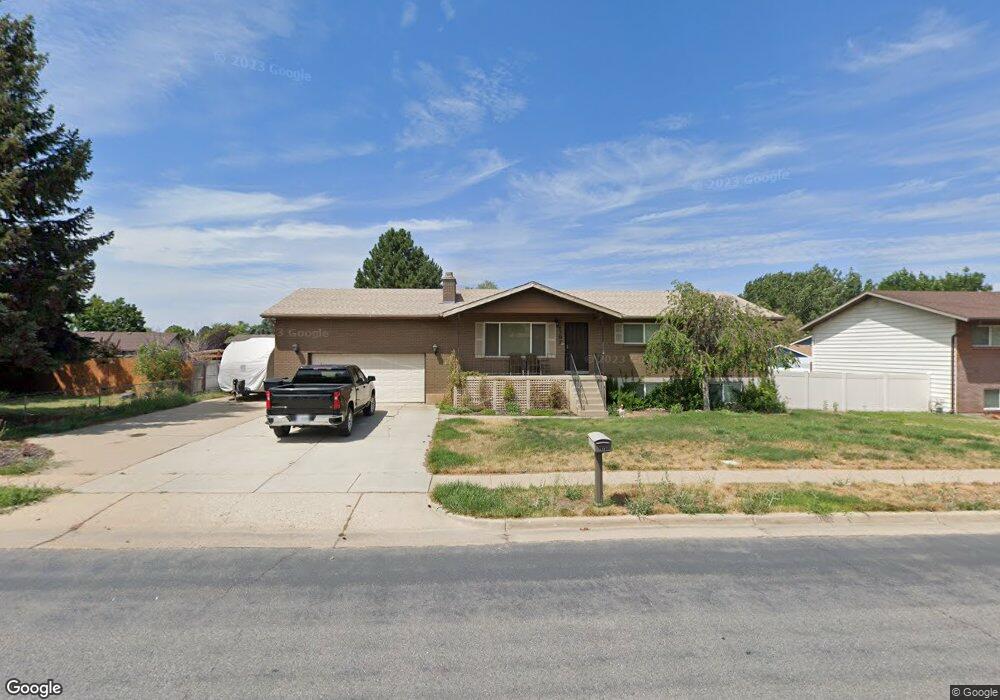
1397 N 550 W Clearfield, UT 84015
Estimated Value: $480,000 - $512,000
4
Beds
3
Baths
2,684
Sq Ft
$184/Sq Ft
Est. Value
About This Home
This home is located at 1397 N 550 W, Clearfield, UT 84015 and is currently estimated at $494,314, approximately $184 per square foot. 1397 N 550 W is a home located in Davis County with nearby schools including Sunset School, Sunset Junior High School, and Clearfield High School.
Ownership History
Date
Name
Owned For
Owner Type
Purchase Details
Closed on
Nov 1, 2016
Sold by
Atwood Tamara
Bought by
Jenson Michael Y
Current Estimated Value
Purchase Details
Closed on
Sep 23, 2009
Sold by
Thompson Ellen Sue and Adkins Robert Val
Bought by
Crosbie Lane
Home Financials for this Owner
Home Financials are based on the most recent Mortgage that was taken out on this home.
Original Mortgage
$162,800
Interest Rate
5.25%
Mortgage Type
FHA
Purchase Details
Closed on
Aug 26, 2002
Sold by
Adkins Ellen
Bought by
Adkins Ellen
Purchase Details
Closed on
Apr 10, 2002
Sold by
Adkins Ellen
Bought by
Adkins Ellen
Purchase Details
Closed on
May 11, 1999
Sold by
Garvis Larry D and Garvis Cleta
Bought by
Adkins Ellen
Home Financials for this Owner
Home Financials are based on the most recent Mortgage that was taken out on this home.
Original Mortgage
$76,500
Interest Rate
6.94%
Create a Home Valuation Report for This Property
The Home Valuation Report is an in-depth analysis detailing your home's value as well as a comparison with similar homes in the area
Home Values in the Area
Average Home Value in this Area
Purchase History
| Date | Buyer | Sale Price | Title Company |
|---|---|---|---|
| Jenson Michael Y | -- | Stewart Title | |
| Crosbie Lane | -- | Founders Title Co Layt | |
| Thompson Ellen Sue | -- | Founders Title Co Layt | |
| Adkins Ellen | -- | Bonneville Title Company Inc | |
| Adkins Ellen | -- | Bonneville Title Company Inc | |
| Adkins Ellen | -- | Surety Title Agency | |
| Adkins Ellen | -- | Equity Title Agency |
Source: Public Records
Mortgage History
| Date | Status | Borrower | Loan Amount |
|---|---|---|---|
| Previous Owner | Crosbie Lane | $162,800 | |
| Previous Owner | Adkins Ellen | $76,500 |
Source: Public Records
Tax History Compared to Growth
Tax History
| Year | Tax Paid | Tax Assessment Tax Assessment Total Assessment is a certain percentage of the fair market value that is determined by local assessors to be the total taxable value of land and additions on the property. | Land | Improvement |
|---|---|---|---|---|
| 2025 | $2,763 | $265,650 | $92,179 | $173,471 |
| 2024 | $2,646 | $255,750 | $101,135 | $154,615 |
| 2023 | $2,432 | $435,000 | $115,398 | $319,602 |
| 2022 | $2,618 | $259,050 | $70,185 | $188,865 |
| 2021 | $2,392 | $351,000 | $88,547 | $262,453 |
| 2020 | $2,072 | $301,000 | $75,603 | $225,397 |
| 2019 | $2,001 | $284,000 | $87,675 | $196,325 |
| 2018 | $1,922 | $268,000 | $73,966 | $194,034 |
| 2016 | $1,548 | $111,430 | $28,879 | $82,551 |
| 2015 | $1,515 | $103,675 | $28,879 | $74,796 |
| 2014 | $1,492 | $103,772 | $28,879 | $74,893 |
| 2013 | -- | $85,967 | $25,230 | $60,737 |
Source: Public Records
Map
Nearby Homes