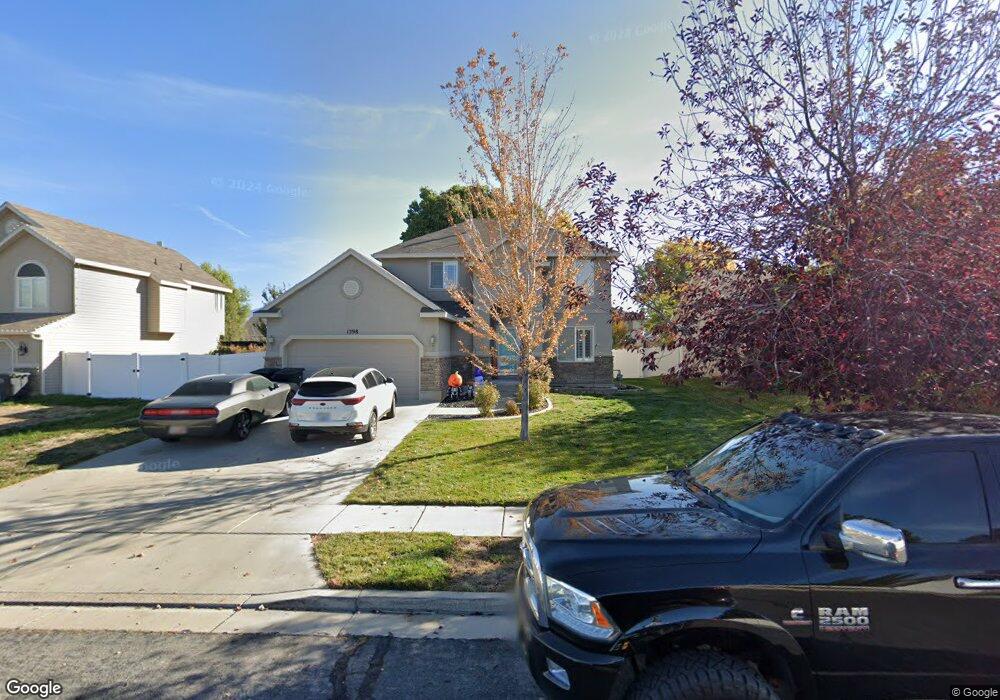
1398 N 2585 W Clearfield, UT 84015
Estimated Value: $506,000 - $570,000
4
Beds
4
Baths
2,486
Sq Ft
$214/Sq Ft
Est. Value
About This Home
This home is located at 1398 N 2585 W, Clearfield, UT 84015 and is currently estimated at $531,138, approximately $213 per square foot. 1398 N 2585 W is a home located in Davis County with nearby schools including West Clinton Elementary School, West Point Junior High School, and Syracuse High School.
Ownership History
Date
Name
Owned For
Owner Type
Purchase Details
Closed on
Aug 8, 2018
Sold by
Fausett Trent V and Fausett Chelsea G
Bought by
Hardy William Clay and Hardy Rebecca
Current Estimated Value
Home Financials for this Owner
Home Financials are based on the most recent Mortgage that was taken out on this home.
Original Mortgage
$320,009
Outstanding Balance
$277,336
Interest Rate
4.5%
Mortgage Type
VA
Estimated Equity
$253,802
Purchase Details
Closed on
Jun 8, 2004
Sold by
North Ivory
Bought by
Fausett Trent and Fausett Chelsea G
Home Financials for this Owner
Home Financials are based on the most recent Mortgage that was taken out on this home.
Original Mortgage
$158,942
Interest Rate
5.99%
Mortgage Type
FHA
Create a Home Valuation Report for This Property
The Home Valuation Report is an in-depth analysis detailing your home's value as well as a comparison with similar homes in the area
Home Values in the Area
Average Home Value in this Area
Purchase History
| Date | Buyer | Sale Price | Title Company |
|---|---|---|---|
| Hardy William Clay | -- | Mountain View Title | |
| Fausett Trent | -- | Bonneville Title Company Inc | |
| North Ivory | -- | Bonneville Title Company Inc |
Source: Public Records
Mortgage History
| Date | Status | Borrower | Loan Amount |
|---|---|---|---|
| Open | Hardy William Clay | $320,009 | |
| Previous Owner | Fausett Trent | $158,942 | |
| Closed | Fausett Trent | $2,493 |
Source: Public Records
Tax History
| Year | Tax Paid | Tax Assessment Tax Assessment Total Assessment is a certain percentage of the fair market value that is determined by local assessors to be the total taxable value of land and additions on the property. | Land | Improvement |
|---|---|---|---|---|
| 2025 | $5,179 | $498,000 | $154,827 | $343,173 |
| 2024 | $4,956 | $263,449 | $94,124 | $169,325 |
| 2023 | $4,666 | $252,450 | $58,397 | $194,052 |
| 2022 | $4,953 | $490,000 | $120,130 | $369,870 |
| 2021 | $2,439 | $358,000 | $80,820 | $277,180 |
| 2020 | $2,121 | $308,000 | $67,689 | $240,311 |
| 2019 | $2,072 | $294,000 | $80,934 | $213,066 |
| 2018 | $1,836 | $256,000 | $68,602 | $187,398 |
| 2016 | $1,638 | $117,921 | $26,505 | $91,416 |
| 2015 | $1,626 | $111,266 | $26,505 | $84,761 |
| 2014 | $1,576 | $109,597 | $26,505 | $83,092 |
| 2013 | -- | $109,143 | $24,320 | $84,823 |
Source: Public Records
Map
Nearby Homes
- 1398 N 2475 W
- 1509 N 2475 W
- 1251 N 2525 W
- 2611 W 1675 N Unit 17
- 1521 N 2275 W
- 2544 W 1675 N
- 1631 N 2340 W
- 2329 W 1680 N
- 1727 N 2700 W
- 2921 W 1300 N
- 2259 W 1800 N
- 1881 N 2350 W Unit 110
- 878 N 2600 W
- 3648 W 900 N Unit 207
- 3941 W 1800 N
- 2298 W 800 N
- 1331 N 1850 W
- 3144 W 1050 N
- 2132 W 800 N
- Harvard Plan at Summerfield - Enclave
Your Personal Tour Guide
Ask me questions while you tour the home.