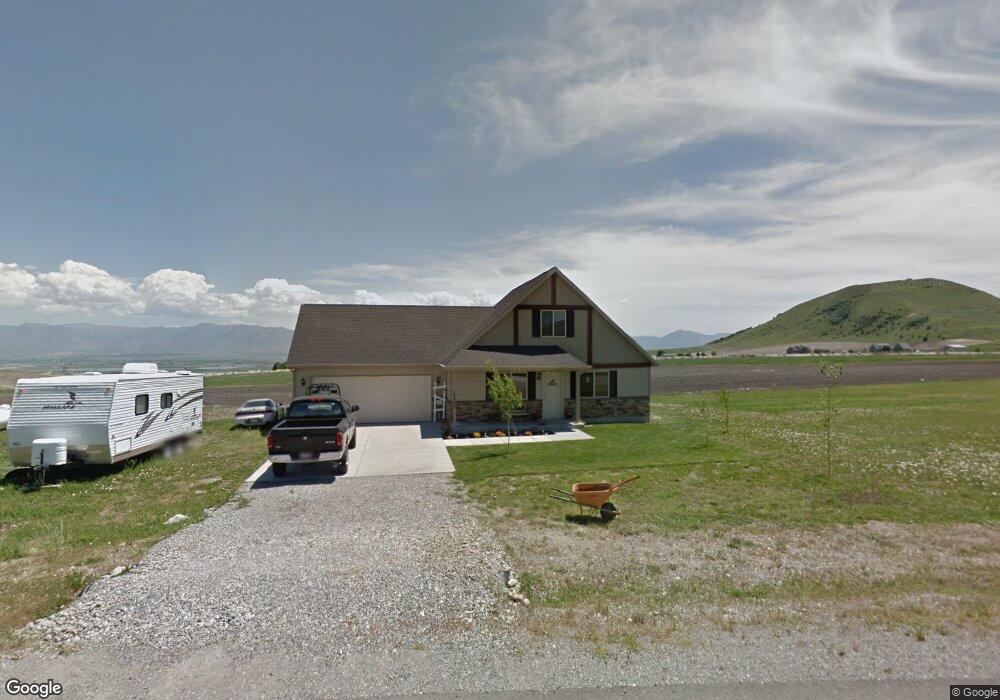
13980 N Willow Creek Dr Beaverdam, UT 84306
Estimated Value: $403,000 - $541,000
2
Beds
2
Baths
1,512
Sq Ft
$295/Sq Ft
Est. Value
About This Home
This home is located at 13980 N Willow Creek Dr, Beaverdam, UT 84306 and is currently estimated at $445,695, approximately $294 per square foot. 13980 N Willow Creek Dr is a home located in Box Elder County with nearby schools including Mountainside School, South Cache Middle School, and Mountain Crest High School.
Ownership History
Date
Name
Owned For
Owner Type
Purchase Details
Closed on
Jan 2, 2020
Sold by
Worthington James C and Worthington Trina Mae
Bought by
Summers Stetson J and Harmon Molly R
Current Estimated Value
Home Financials for this Owner
Home Financials are based on the most recent Mortgage that was taken out on this home.
Original Mortgage
$251,750
Outstanding Balance
$222,431
Interest Rate
3.6%
Mortgage Type
New Conventional
Estimated Equity
$223,264
Purchase Details
Closed on
May 27, 2010
Sold by
Worthington James C
Bought by
Worthington James C and Worthington Trina Mae
Home Financials for this Owner
Home Financials are based on the most recent Mortgage that was taken out on this home.
Original Mortgage
$152,192
Interest Rate
5.03%
Mortgage Type
FHA
Purchase Details
Closed on
Mar 10, 2010
Sold by
Veibell J Alton
Bought by
Sierra Homes Construction Inc
Create a Home Valuation Report for This Property
The Home Valuation Report is an in-depth analysis detailing your home's value as well as a comparison with similar homes in the area
Home Values in the Area
Average Home Value in this Area
Purchase History
| Date | Buyer | Sale Price | Title Company |
|---|---|---|---|
| Summers Stetson J | -- | Cache Title Company | |
| Worthington James C | -- | -- | |
| Worthington James C | -- | -- | |
| Sierra Homes Construction Inc | -- | -- |
Source: Public Records
Mortgage History
| Date | Status | Borrower | Loan Amount |
|---|---|---|---|
| Open | Summers Stetson J | $251,750 | |
| Previous Owner | Worthington James C | $152,192 |
Source: Public Records
Tax History Compared to Growth
Tax History
| Year | Tax Paid | Tax Assessment Tax Assessment Total Assessment is a certain percentage of the fair market value that is determined by local assessors to be the total taxable value of land and additions on the property. | Land | Improvement |
|---|---|---|---|---|
| 2025 | $1,612 | $358,721 | $130,000 | $228,721 |
| 2024 | $1,612 | $358,925 | $130,000 | $228,925 |
| 2023 | $1,676 | $377,195 | $130,000 | $247,195 |
| 2022 | $1,494 | $174,447 | $35,750 | $138,697 |
| 2021 | $1,334 | $287,320 | $41,000 | $246,320 |
| 2020 | $1,564 | $287,320 | $41,000 | $246,320 |
| 2019 | $1,395 | $135,446 | $22,550 | $112,896 |
| 2018 | $1,331 | $120,721 | $22,550 | $98,171 |
| 2017 | $1,380 | $219,493 | $22,550 | $178,493 |
| 2016 | $1,316 | $116,046 | $22,550 | $93,496 |
| 2015 | $1,186 | $107,546 | $22,550 | $84,996 |
| 2014 | $1,186 | $103,499 | $22,550 | $80,949 |
| 2013 | -- | $96,140 | $22,550 | $73,590 |
Source: Public Records
Map
Nearby Homes
- 13945 N Willow Creek Dr
- 13645 Highlander Cir
- 2666 Valley View W
- 6950 W 2700 N Unit 7
- 2430 N 6750 W Unit 9
- 15600 N Beaver Dam Rd
- 1667 N 6400 W
- 12925 N 3490 W Unit 17
- 16408 N Beaver Dam Rd
- 941 N 75 W Unit 62
- 73 W 1050 N Unit 17
- 972 N 75 W Unit 12
- 876 N 75 W Unit 9
- 802 N 75 W Unit 8
- 74 W 850 N Unit 7
- 42 W 850 N Unit 5
- 915 N 75 W Unit 61
- 850 N 73 W Unit 60
- 850 N 51 W Unit 59
- 26 W 850 N Unit 4
- 13980 N Willow Creek Dr Unit 27
- 14065 N Willow Creek Dr Unit 16
- 14065 N Willow Creek Dr Unit 14
- 13985 N Willow Creek Dr Unit 15
- 13985 N Willow Creek Dr
- 13960 N Willow Creek Dr
- 13960 N Willow Creek Dr Unit 26
- 14025 N Willowcreek Dr
- 14025 N Willow Creek Dr
- 14025 N Willow Creek Dr
- 14025 N Willow Creek Dr
- 1882 N 8150 W
- 1859 N 8150 W
- 1882 N 8150 W Unit 11
- 1859 N 8150 W Unit 21
- 1854 N 8150 W Unit 12
- 1801 N 8150 W Unit 23
- 1827 N 8150 W Unit 22
- 13940 N Willow Creek Dr Unit 25
- 13965 N Willow Creek Dr