Estimated Value: $524,000 - $825,000
3
Beds
2
Baths
1,567
Sq Ft
$443/Sq Ft
Est. Value
About This Home
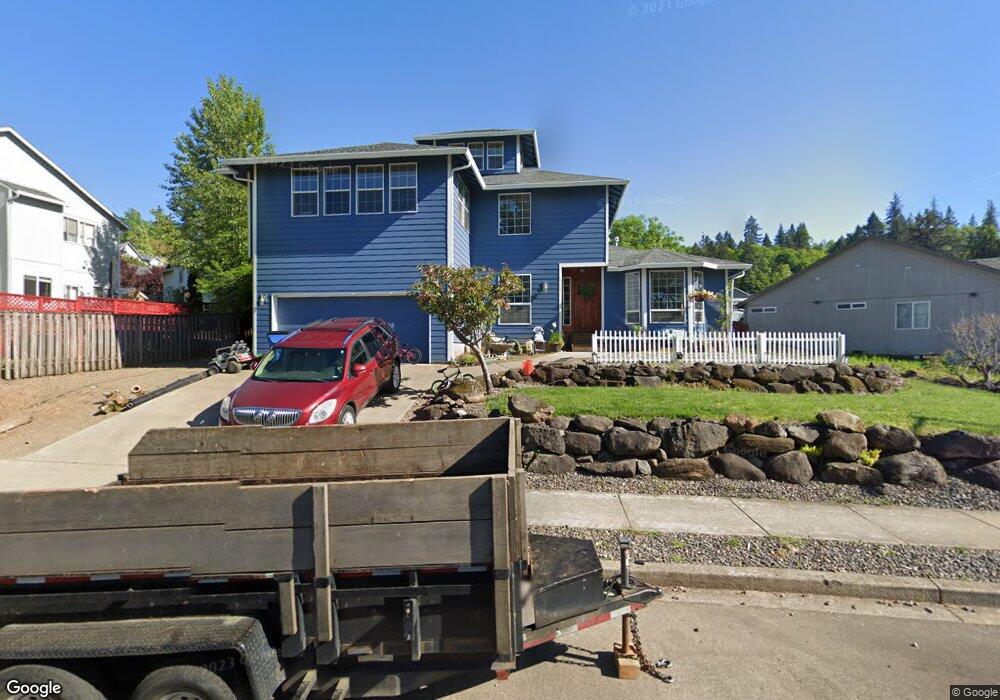
This home is located at 1399 NW 8th Ave, Camas, WA 98607 and is currently estimated at $693,818, approximately $442 per square foot. 1399 NW 8th Ave is a home located in Clark County with nearby schools including Prune Hill Elementary School, Skyridge Middle School, and Camas High School.
Ownership History
Date
Name
Owned For
Owner Type
Purchase Details
Closed on
Mar 23, 2017
Sold by
Knight Glen
Bought by
Knight Ellyn A
Current Estimated Value
Home Financials for this Owner
Home Financials are based on the most recent Mortgage that was taken out on this home.
Original Mortgage
$256,000
Outstanding Balance
$212,289
Interest Rate
4.17%
Mortgage Type
New Conventional
Estimated Equity
$481,529
Purchase Details
Closed on
Nov 14, 2010
Sold by
Hsbc Bank Usa
Bought by
Cyr Ellyn A
Home Financials for this Owner
Home Financials are based on the most recent Mortgage that was taken out on this home.
Original Mortgage
$189,072
Interest Rate
4.25%
Mortgage Type
FHA
Purchase Details
Closed on
Mar 19, 2010
Sold by
Miller Nathan L
Bought by
Hsbc Bank Usa
Purchase Details
Closed on
Sep 3, 2002
Sold by
Kimball Hill Homes Washington Inc
Bought by
Miller Nathan L
Home Financials for this Owner
Home Financials are based on the most recent Mortgage that was taken out on this home.
Original Mortgage
$151,180
Interest Rate
6.29%
Create a Home Valuation Report for This Property
The Home Valuation Report is an in-depth analysis detailing your home's value as well as a comparison with similar homes in the area
Home Values in the Area
Average Home Value in this Area
Purchase History
| Date | Buyer | Sale Price | Title Company |
|---|---|---|---|
| Knight Ellyn A | -- | Wfg Natl Title Of Clark Cnty | |
| Cyr Ellyn A | $194,000 | Accommodation | |
| Hsbc Bank Usa | $178,281 | None Available | |
| Miller Nathan L | -- | Chicago Title Insurance |
Source: Public Records
Mortgage History
| Date | Status | Borrower | Loan Amount |
|---|---|---|---|
| Open | Knight Ellyn A | $256,000 | |
| Closed | Cyr Ellyn A | $189,072 | |
| Previous Owner | Miller Nathan L | $151,180 |
Source: Public Records
Tax History Compared to Growth
Tax History
| Year | Tax Paid | Tax Assessment Tax Assessment Total Assessment is a certain percentage of the fair market value that is determined by local assessors to be the total taxable value of land and additions on the property. | Land | Improvement |
|---|---|---|---|---|
| 2025 | $6,545 | $573,417 | $122,500 | $450,917 |
| 2024 | $5,705 | $686,669 | $185,500 | $501,169 |
| 2023 | $6,354 | $643,403 | $181,000 | $462,403 |
| 2022 | $5,932 | $681,608 | $181,000 | $500,608 |
| 2021 | $5,969 | $531,889 | $142,750 | $389,139 |
| 2020 | $3,609 | $496,056 | $133,750 | $362,306 |
| 2019 | $4,270 | $278,008 | $122,500 | $155,508 |
| 2018 | $4,279 | $350,439 | $0 | $0 |
| 2017 | $3,704 | $295,164 | $0 | $0 |
| 2016 | $3,230 | $278,189 | $0 | $0 |
| 2015 | $3,033 | $241,367 | $0 | $0 |
| 2014 | -- | $213,702 | $0 | $0 |
| 2013 | -- | $193,282 | $0 | $0 |
Source: Public Records
Map
Nearby Homes
- 1945 NW 7th Ave
- 907 NW Greeley St
- 802 NW 5th Cir Unit 802
- 715 NW 10th Ave
- 912 NW Fargo St
- 1938 NW Sierra Ln
- 634 NW 5th Ave
- 615 NW 7th Ave
- 541 NW 8th Ave
- 536 NW 10th Ave
- 535 NW 9th Ave
- 2012 NW Sierra Ln
- 2229 NW 6th Place
- 2534 NW 16th Ave
- 2546 NW 16th Ave
- 2458 NW 16th Ave
- 441 NW 15th Ave
- 737 NW 20th Ave
- 2311 SW 6th Ave Unit 8B
- 2311 SW 6th Ave Unit D2
- 1377 NW 8th Ave
- 856 NW Norwood Ct
- 818 NW Norwood Ct
- 840 NW Norwood Ct
- 833 NW Magnolia St
- 1384 NW 8th Ave
- 853 NW Magnolia St
- 864 NW Norwood Ct
- 1414 NW 8th Ave
- 817 NW Norwood Ct
- 831 NW Norwood Ct
- 867 NW Magnolia St
- 1428 NW 8th Ave
- 1361 NW 7th Ave
- 847 NW Norwood Ct
- 866 NW Norwood Ct
- 1371 NW 7th Ave
- 861 NW Norwood Ct
- 1401 NW 7th Ave
- 828 NW Magnolia St