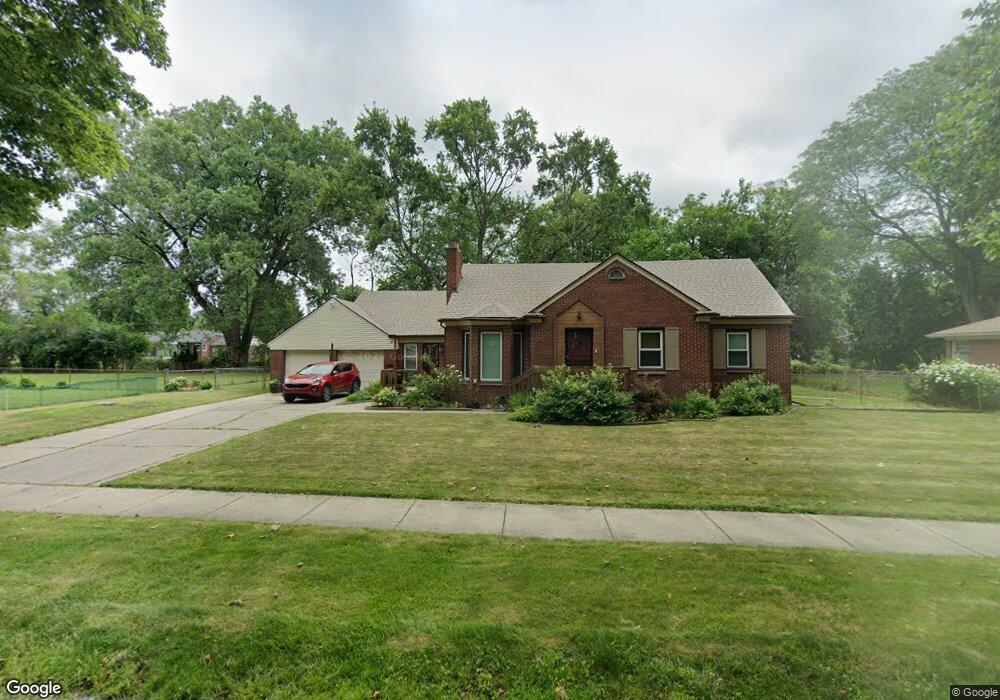
13990 Farley Redford, MI 48239
Estimated Value: $239,149 - $270,000
3
Beds
1
Bath
1,549
Sq Ft
$164/Sq Ft
Est. Value
About This Home
This home is located at 13990 Farley, Redford, MI 48239 and is currently estimated at $254,537, approximately $164 per square foot. 13990 Farley is a home located in Wayne County with nearby schools including John D. Pierce Middle School, Lee M. Thurston High School, and Detroit Leadership Academy.
Ownership History
Date
Name
Owned For
Owner Type
Purchase Details
Closed on
Feb 22, 2023
Sold by
Joseph Desery
Bought by
Joseph Laurel
Current Estimated Value
Home Financials for this Owner
Home Financials are based on the most recent Mortgage that was taken out on this home.
Original Mortgage
$164,900
Outstanding Balance
$159,556
Interest Rate
6.15%
Mortgage Type
New Conventional
Estimated Equity
$94,981
Purchase Details
Closed on
Jul 16, 2010
Sold by
Donovan Shaun and Secretary Of Housing & Urban D
Bought by
Joseph Desery
Purchase Details
Closed on
Jan 20, 2010
Sold by
Wells Fargo Bank Na
Bought by
The Secretary Of Housing & Urban Develop
Purchase Details
Closed on
Jul 16, 2009
Sold by
Taylor Timothy G and Horn Christey
Bought by
Wells Fargo Bank Na
Purchase Details
Closed on
Jun 15, 2001
Sold by
Lindow Gary D
Bought by
Horn Christey
Create a Home Valuation Report for This Property
The Home Valuation Report is an in-depth analysis detailing your home's value as well as a comparison with similar homes in the area
Home Values in the Area
Average Home Value in this Area
Purchase History
| Date | Buyer | Sale Price | Title Company |
|---|---|---|---|
| Joseph Laurel | $170,000 | -- | |
| Joseph Desery | $75,000 | None Available | |
| The Secretary Of Housing & Urban Develop | -- | None Available | |
| Wells Fargo Bank Na | $170,496 | None Available | |
| Horn Christey | $169,900 | -- |
Source: Public Records
Mortgage History
| Date | Status | Borrower | Loan Amount |
|---|---|---|---|
| Open | Joseph Laurel | $164,900 |
Source: Public Records
Tax History Compared to Growth
Tax History
| Year | Tax Paid | Tax Assessment Tax Assessment Total Assessment is a certain percentage of the fair market value that is determined by local assessors to be the total taxable value of land and additions on the property. | Land | Improvement |
|---|---|---|---|---|
| 2025 | $1,081 | $113,900 | $0 | $0 |
| 2024 | $1,081 | $106,000 | $0 | $0 |
| 2023 | $1,035 | $95,300 | $0 | $0 |
| 2022 | $3,767 | $85,400 | $0 | $0 |
| 2021 | $3,269 | $79,200 | $0 | $0 |
| 2020 | $2,992 | $69,500 | $0 | $0 |
| 2019 | $2,778 | $64,900 | $0 | $0 |
| 2018 | $932 | $55,500 | $0 | $0 |
| 2017 | $3,223 | $52,500 | $0 | $0 |
| 2016 | $2,512 | $48,700 | $0 | $0 |
| 2015 | $3,912 | $44,100 | $0 | $0 |
| 2013 | $3,790 | $38,700 | $0 | $0 |
| 2012 | $2,478 | $42,900 | $10,200 | $32,700 |
Source: Public Records
Map
Nearby Homes
- 13949 Farley
- 24777 Ashley Ct Unit 5
- 14355 Brady
- 24790 Ashley Ct Unit 23
- 13973 Dixie
- 24629 Westgate Dr
- 14248 Dixie
- 12838 Sarasota
- 12845 Centralia
- 12864 Berwyn
- 26235 Ross Dr
- 13591 Lenore
- 13563 Lenore
- 25587 Ivanhoe
- 14267 Westgate Dr
- 24516 Lyndon
- 14910 Aubrey
- 14041 Minock Dr
- 13965 Minock Dr
- 26561 Kendall Ct