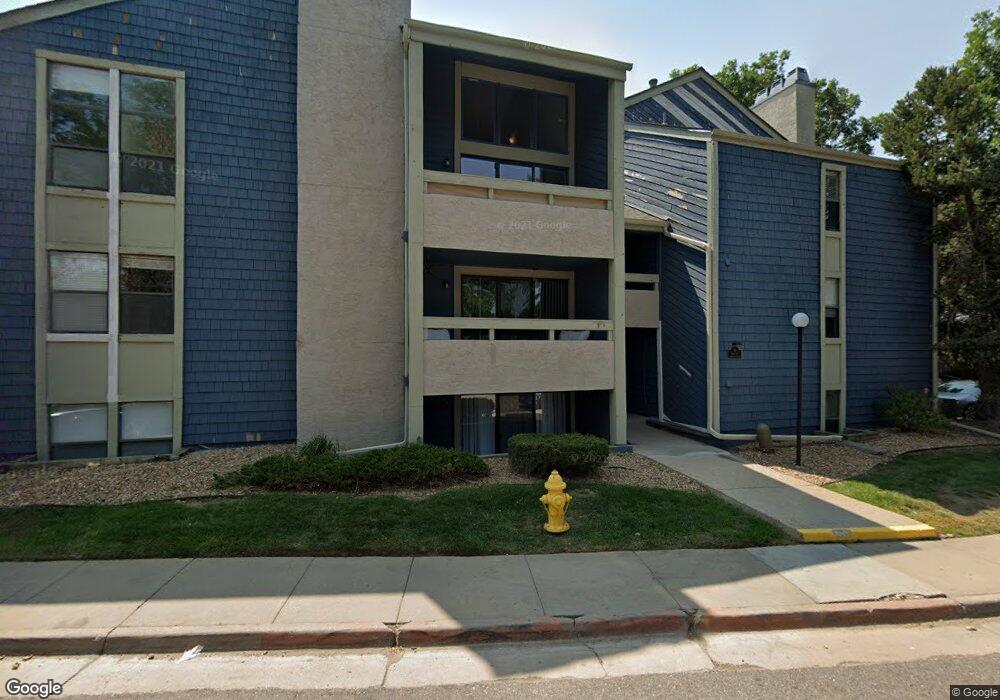
13992 E Stanford Cir Unit M07 Aurora, CO 80015
Estimated Value: $199,000 - $220,000
1
Bed
1
Bath
792
Sq Ft
$266/Sq Ft
Est. Value
About This Home
This home is located at 13992 E Stanford Cir Unit M07, Aurora, CO 80015 and is currently estimated at $210,385, approximately $265 per square foot. 13992 E Stanford Cir Unit M07 is a home located in Arapahoe County with nearby schools including Sagebrush Elementary School, Laredo Middle School, and Smoky Hill High School.
Ownership History
Date
Name
Owned For
Owner Type
Purchase Details
Closed on
Sep 26, 2021
Sold by
Lam Rowya and Pegues Rowya
Bought by
Pegues Rowya
Current Estimated Value
Home Financials for this Owner
Home Financials are based on the most recent Mortgage that was taken out on this home.
Original Mortgage
$90,000
Outstanding Balance
$81,356
Interest Rate
2.8%
Mortgage Type
New Conventional
Estimated Equity
$129,029
Purchase Details
Closed on
Feb 23, 1999
Sold by
Langren Neal R and Langren Diane M
Bought by
Lam Rowya
Home Financials for this Owner
Home Financials are based on the most recent Mortgage that was taken out on this home.
Original Mortgage
$51,410
Interest Rate
6.83%
Purchase Details
Closed on
Sep 6, 1997
Sold by
Langren Diane Abbott and Langren Diane M
Bought by
Langren Diane M and Langren Neal R
Purchase Details
Closed on
May 1, 1982
Sold by
Conversion Arapco
Bought by
Conversion Arapco
Purchase Details
Closed on
Mar 1, 1980
Bought by
Conversion Arapco
Create a Home Valuation Report for This Property
The Home Valuation Report is an in-depth analysis detailing your home's value as well as a comparison with similar homes in the area
Purchase History
| Date | Buyer | Sale Price | Title Company |
|---|---|---|---|
| Pegues Rowya | -- | Land Title Guarantee Company | |
| Lam Rowya | $53,000 | First American Heritage Titl | |
| Langren Diane M | -- | -- | |
| Conversion Arapco | -- | -- | |
| Conversion Arapco | -- | -- |
Source: Public Records
Mortgage History
| Date | Status | Borrower | Loan Amount |
|---|---|---|---|
| Open | Pegues Rowya | $90,000 | |
| Closed | Lam Rowya | $51,410 |
Source: Public Records
Tax History
| Year | Tax Paid | Tax Assessment Tax Assessment Total Assessment is a certain percentage of the fair market value that is determined by local assessors to be the total taxable value of land and additions on the property. | Land | Improvement |
|---|---|---|---|---|
| 2025 | $1,068 | $13,469 | -- | -- |
| 2024 | $943 | $13,541 | -- | -- |
| 2023 | $943 | $13,541 | $0 | $0 |
| 2022 | $774 | $10,613 | $0 | $0 |
| 2021 | $779 | $10,613 | $0 | $0 |
| 2020 | $809 | $11,190 | $0 | $0 |
| 2019 | $780 | $11,190 | $0 | $0 |
| 2018 | $566 | $7,625 | $0 | $0 |
| 2017 | $558 | $7,625 | $0 | $0 |
| 2016 | $413 | $5,293 | $0 | $0 |
| 2015 | $393 | $5,293 | $0 | $0 |
| 2014 | -- | $2,746 | $0 | $0 |
| 2013 | -- | $3,220 | $0 | $0 |
Source: Public Records
Map
Nearby Homes
- 13982 E Stanford Cir Unit N02
- 4538 S Atchison Way
- 13831 E Stanford Place
- 4505 S Auckland Ct
- 4313 S Atchison Cir
- 14093 E Radcliff Cir
- 14190 E Temple Dr Unit 2
- 14080 E Quinn Cir
- 14100 E Temple Dr Unit 5
- 14183 E Quinn Cir
- 4242 S Blackhawk Cir Unit 4D
- 14120 E Temple Dr Unit Y04
- 13942 E Princeton Place Unit C
- 4971 S Parker Rd
- 4271 S Blackhawk Cir Unit 2C
- 4665 S Dillon Ct Unit B
- 14358 E Pimlico Place Unit A125
- 4656 S Dillon Ct Unit D
- 4694 S Crystal Way Unit D111
- 4211 S Blackhawk Cir Unit 8C
- 13992 E Stanford Cir Unit M12
- 13992 E Stanford Cir Unit M11
- 13992 E Stanford Cir Unit M10
- 13992 E Stanford Cir Unit M09
- 13992 E Stanford Cir Unit M08
- 13992 E Stanford Cir Unit M06
- 13992 E Stanford Cir Unit M05
- 13992 E Stanford Cir Unit M04
- 13992 E Stanford Cir Unit M03
- 13992 E Stanford Cir Unit M02
- 13992 E Stanford Cir Unit M01
- 13992 E Stanford Cir Unit MM10
- 13982 E Stanford Cir Unit N12
- 13982 E Stanford Cir Unit N11
- 13982 E Stanford Cir Unit N10
- 13982 E Stanford Cir Unit N09
- 13982 E Stanford Cir Unit N08
- 13982 E Stanford Cir Unit N07
- 13982 E Stanford Cir Unit N06
- 13982 E Stanford Cir Unit N05
Your Personal Tour Guide
Ask me questions while you tour the home.