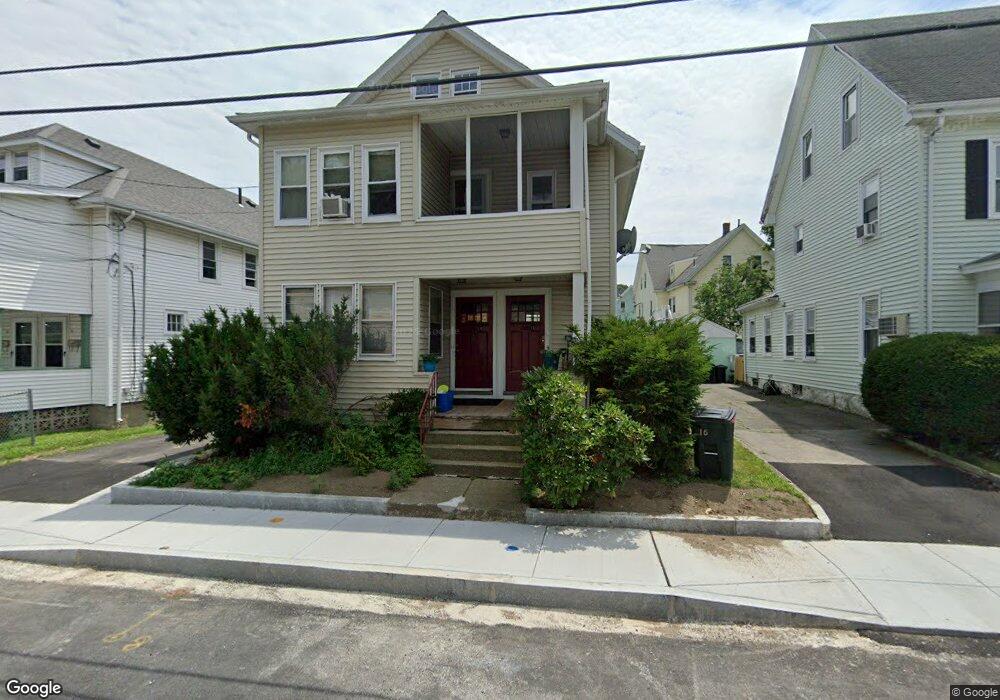
14-16 N Payne St Quincy, MA 02169
South Quincy NeighborhoodEstimated Value: $762,000 - $908,000
4
Beds
2
Baths
2,230
Sq Ft
$375/Sq Ft
Est. Value
About This Home
This home is located at 14-16 N Payne St, Quincy, MA 02169 and is currently estimated at $836,595, approximately $375 per square foot. 14-16 N Payne St is a home located in Norfolk County with nearby schools including Lincoln-Hancock Community School, South West Middle School, and Quincy High School.
Ownership History
Date
Name
Owned For
Owner Type
Purchase Details
Closed on
Nov 12, 1998
Sold by
Macdonald Janet E
Bought by
Hin Sang C and Hin Jackie
Current Estimated Value
Home Financials for this Owner
Home Financials are based on the most recent Mortgage that was taken out on this home.
Original Mortgage
$167,485
Interest Rate
6.65%
Mortgage Type
Purchase Money Mortgage
Purchase Details
Closed on
Aug 30, 1996
Sold by
Russo William F and Russo Mary E
Bought by
Mcdonald Janet E
Home Financials for this Owner
Home Financials are based on the most recent Mortgage that was taken out on this home.
Original Mortgage
$100,000
Interest Rate
8.18%
Mortgage Type
Purchase Money Mortgage
Create a Home Valuation Report for This Property
The Home Valuation Report is an in-depth analysis detailing your home's value as well as a comparison with similar homes in the area
Home Values in the Area
Average Home Value in this Area
Purchase History
| Date | Buyer | Sale Price | Title Company |
|---|---|---|---|
| Hin Sang C | $177,150 | -- | |
| Mcdonald Janet E | $160,000 | -- |
Source: Public Records
Mortgage History
| Date | Status | Borrower | Loan Amount |
|---|---|---|---|
| Open | Mcdonald Janet E | $210,000 | |
| Closed | Mcdonald Janet E | $167,485 | |
| Previous Owner | Mcdonald Janet E | $100,000 |
Source: Public Records
Tax History Compared to Growth
Tax History
| Year | Tax Paid | Tax Assessment Tax Assessment Total Assessment is a certain percentage of the fair market value that is determined by local assessors to be the total taxable value of land and additions on the property. | Land | Improvement |
|---|---|---|---|---|
| 2025 | $7,965 | $690,800 | $247,100 | $443,700 |
| 2024 | $7,502 | $665,700 | $235,300 | $430,400 |
| 2023 | $7,023 | $631,000 | $213,900 | $417,100 |
| 2022 | $6,799 | $567,500 | $178,300 | $389,200 |
| 2021 | $6,921 | $570,100 | $178,300 | $391,800 |
| 2020 | $6,854 | $551,400 | $178,300 | $373,100 |
| 2019 | $6,534 | $520,600 | $168,200 | $352,400 |
| 2018 | $6,051 | $453,600 | $155,700 | $297,900 |
| 2017 | $6,096 | $430,200 | $148,300 | $281,900 |
| 2016 | $5,392 | $375,500 | $129,000 | $246,500 |
| 2015 | $5,297 | $362,800 | $129,000 | $233,800 |
| 2014 | $4,642 | $312,400 | $129,000 | $183,400 |
Source: Public Records
Map
Nearby Homes
- 5 Pearl St
- 166 Phipps St
- 155 Kendrick Ave Unit T7
- 83 Madison Ave
- 57 Summer St
- 8 Jackson St Unit B2
- 72 Federal Ave
- 33 Brook Rd
- 18 Cliveden St Unit 201W
- 165 Granite St
- 94 Brook Rd Unit 3
- 2 Cliveden St Unit 601E
- 34 South St Unit 202
- 5 Main St
- 36 Bigelow St
- 123 Elm St Unit D-8
- 293 Whitwell St
- 32 Sumner St
- 35 Sumner St
- 215 Thomas Burgin Pkwy Unit 35
- 14 N Payne St
- 12 N Payne St Unit 12
- 10 N Payne St
- 10 N Payne St Unit 10
- 10 N Payne St Unit 12
- 18 N Payne St
- 29 Payne St
- 29 Payne St Unit X
- 13 N Payne St
- 13 N Payne St Unit 13
- 33 Payne St Unit 2
- 33 Payne St
- 33 Payne St Unit 1
- 11 N Payne St
- 24 N Payne St
- 7 N Payne St
- 19 N Payne St
- 39 Payne St
- 30 N Payne St
- 25 N Payne St