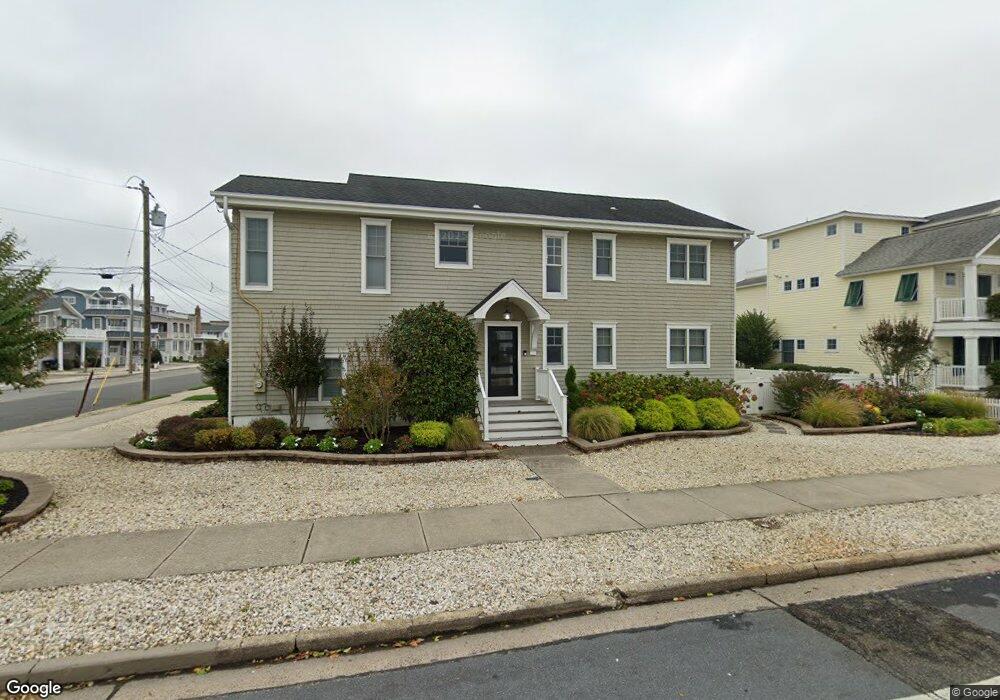
14 26th St E Avalon, NJ 08202
Estimated Value: $2,404,000 - $5,100,000
Studio
--
Bath
2,306
Sq Ft
$1,549/Sq Ft
Est. Value
About This Home
This home is located at 14 26th St E, Avalon, NJ 08202 and is currently estimated at $3,571,743, approximately $1,548 per square foot. 14 26th St E is a home located in Cape May County with nearby schools including Avalon Elementary School.
Ownership History
Date
Name
Owned For
Owner Type
Purchase Details
Closed on
Jan 26, 2004
Sold by
Giblin Robert E
Bought by
Giblin Robert E
Current Estimated Value
Purchase Details
Closed on
Jan 8, 2004
Sold by
Giblin Josephine R
Bought by
Giblin Robert E
Purchase Details
Closed on
Oct 15, 1997
Sold by
Russino Joseph L
Bought by
Giblin Josephine R
Purchase Details
Closed on
Oct 17, 1992
Sold by
Atkins Jr Joseph P and Atkins Maureen M
Bought by
Russino Joseph L and Russino Linda
Purchase Details
Closed on
Sep 1, 1988
Sold by
Leahy Realty Inc
Bought by
Atkins Joseph and Atkins Maureen
Create a Home Valuation Report for This Property
The Home Valuation Report is an in-depth analysis detailing your home's value as well as a comparison with similar homes in the area
Home Values in the Area
Average Home Value in this Area
Purchase History
| Date | Buyer | Sale Price | Title Company |
|---|---|---|---|
| Giblin Robert E | -- | -- | |
| Giblin Robert E | -- | -- | |
| Giblin Josephine R | $487,500 | -- | |
| Russino Joseph L | $445,000 | -- | |
| Atkins Joseph | $454,000 | -- |
Source: Public Records
Tax History
| Year | Tax Paid | Tax Assessment Tax Assessment Total Assessment is a certain percentage of the fair market value that is determined by local assessors to be the total taxable value of land and additions on the property. | Land | Improvement |
|---|---|---|---|---|
| 2025 | $12,855 | $2,093,600 | $1,715,400 | $378,200 |
| 2024 | $12,855 | $2,093,600 | $1,715,400 | $378,200 |
| 2023 | $12,750 | $2,093,600 | $1,715,400 | $378,200 |
| 2022 | $11,892 | $2,093,600 | $1,715,400 | $378,200 |
| 2021 | $11,108 | $2,030,700 | $1,715,400 | $315,300 |
| 2020 | $10,681 | $2,030,700 | $1,715,400 | $315,300 |
| 2019 | $10,357 | $2,030,700 | $1,715,400 | $315,300 |
| 2018 | $9,910 | $2,030,700 | $1,715,400 | $315,300 |
| 2017 | $8,985 | $1,616,000 | $1,319,000 | $297,000 |
| 2016 | $8,888 | $1,616,000 | $1,319,000 | $297,000 |
| 2015 | $8,743 | $1,616,000 | $1,319,000 | $297,000 |
| 2014 | $8,646 | $1,616,000 | $1,319,000 | $297,000 |
Source: Public Records
Map
Nearby Homes
- 8 27th St Unit West
- 29 28th St E Unit 7
- 74 26th St E
- 2958 Avalon Ave
- 53 25th St E
- 2968 First Ave
- 2988 1st Ave
- 179 27th St
- 25 32nd St W
- 55 32nd St W Unit C2B
- 55 32nd St W
- 55 32nd St W Unit 1A
- 3149 First Ave
- 161 24th St
- 174 23rd St
- 212 25th St Unit End Unit
- 118 22nd St
- 179 32nd St
- 76 21st St W
- 158 32nd St
Your Personal Tour Guide
Ask me questions while you tour the home.