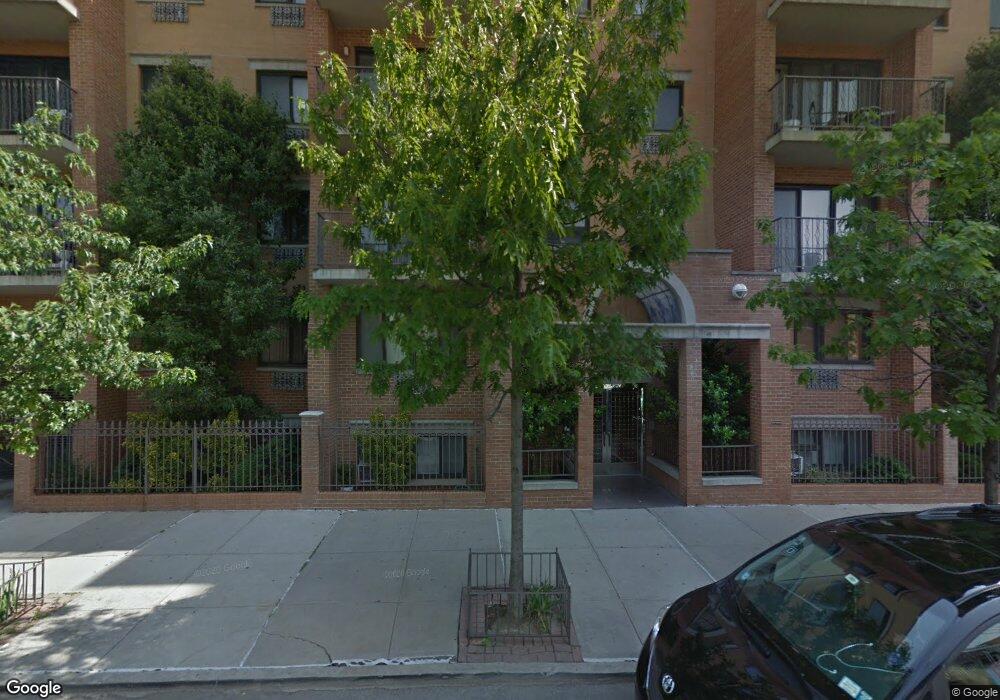
14-43 28th Ave Unit 4B Astoria, NY 11102
Astoria NeighborhoodEstimated Value: $416,310 - $573,000
--
Bed
1
Bath
400
Sq Ft
$1,208/Sq Ft
Est. Value
About This Home
This home is located at 14-43 28th Ave Unit 4B, Astoria, NY 11102 and is currently estimated at $483,078, approximately $1,207 per square foot. 14-43 28th Ave Unit 4B is a home located in Queens County with nearby schools including P.S.171 Peter G.Van Alst Elementary School, I.S. 126Q Albert Shanker School Community School, and William Cullen Bryant High School.
Ownership History
Date
Name
Owned For
Owner Type
Purchase Details
Closed on
Feb 10, 2017
Sold by
Amzallag Jonathan
Bought by
Monge Brandy
Current Estimated Value
Home Financials for this Owner
Home Financials are based on the most recent Mortgage that was taken out on this home.
Original Mortgage
$340,000
Outstanding Balance
$281,269
Interest Rate
4.17%
Estimated Equity
$201,809
Purchase Details
Closed on
Oct 12, 2015
Sold by
Emme Elaine
Bought by
Amzallag Jonathan
Purchase Details
Closed on
Sep 28, 2005
Sold by
14-47 Associates Llc
Bought by
Emme Elaine
Home Financials for this Owner
Home Financials are based on the most recent Mortgage that was taken out on this home.
Original Mortgage
$208,000
Interest Rate
5.78%
Mortgage Type
Purchase Money Mortgage
Create a Home Valuation Report for This Property
The Home Valuation Report is an in-depth analysis detailing your home's value as well as a comparison with similar homes in the area
Home Values in the Area
Average Home Value in this Area
Purchase History
| Date | Buyer | Sale Price | Title Company |
|---|---|---|---|
| Monge Brandy | $400,000 | -- | |
| Amzallag Jonathan | $335,000 | -- | |
| Emme Elaine | $263,640 | -- |
Source: Public Records
Mortgage History
| Date | Status | Borrower | Loan Amount |
|---|---|---|---|
| Open | Monge Brandy | $340,000 | |
| Previous Owner | Emme Elaine | $208,000 |
Source: Public Records
Tax History Compared to Growth
Tax History
| Year | Tax Paid | Tax Assessment Tax Assessment Total Assessment is a certain percentage of the fair market value that is determined by local assessors to be the total taxable value of land and additions on the property. | Land | Improvement |
|---|---|---|---|---|
| 2025 | $405 | $37,893 | $2,760 | $35,133 |
| 2024 | $405 | $33,014 | $2,760 | $30,254 |
| 2023 | $405 | $34,213 | $2,760 | $31,453 |
| 2022 | $397 | $35,598 | $2,760 | $32,838 |
| 2021 | $398 | $31,891 | $2,760 | $29,131 |
| 2020 | $404 | $35,580 | $2,760 | $32,820 |
| 2019 | $409 | $36,243 | $2,760 | $33,483 |
| 2018 | $412 | $28,844 | $2,760 | $26,084 |
| 2017 | $412 | $25,967 | $2,760 | $23,207 |
| 2016 | $418 | $25,967 | $2,760 | $23,207 |
| 2015 | $327 | $20,767 | $2,760 | $18,007 |
| 2014 | $327 | $18,255 | $2,760 | $15,495 |
Source: Public Records
Map
Nearby Homes
- 18-10 Astoria Blvd
- 28-6 21st St Unit 6 FA
- 18-21 26th Ave
- 26-19 14th Place
- 25-04 21st St
- 2504 21st St
- 1446A 30th Ave Unit A
- 21-24 30th Ave
- 30-11 21st St Unit 5C
- 12-21 30th Ave
- 12-16 30th Ave Unit 201
- 12-16 30th Ave Unit 305
- 12-16 30th Ave Unit PH1
- 12-16 30th Ave Unit 402
- 12-16 30th Ave Unit 202
- 12-16 30th Ave Unit 304
- 12-16 30th Ave Unit 302
- 12-16 30th Ave Unit 401
- 12-16 30th Ave Unit 203
- 12-16 30th Ave Unit 301
- 14-43 28th Ave Unit 2B
- 14-43 28th Ave Unit 1E
- 14-43 28th Ave Unit 2A
- 14-43 28th Ave Unit 4A
- 14-43 28th Ave Unit 5C
- 14-43 28th Ave Unit 3F
- 14-43 28th Ave Unit 2-H
- 14-43 28th Ave Unit 1-G
- 14-43 28th Ave Unit B1
- 14-43 28th Ave
- 14-43 28th Ave Unit 3
- 14-43 28th Ave Unit 3A
- 14-43 28th Ave Unit 2-F
- 14-43 28th Ave Unit 1B
- 14-43 28th Ave Unit 3D
- 14-43 28th Ave Unit 5E
- 14-43 28th Ave Unit 1D
- 14-43 28th Ave Unit 5A
- 14-43 28th Ave Unit 2D
- 14-43 28th Ave Unit BB1