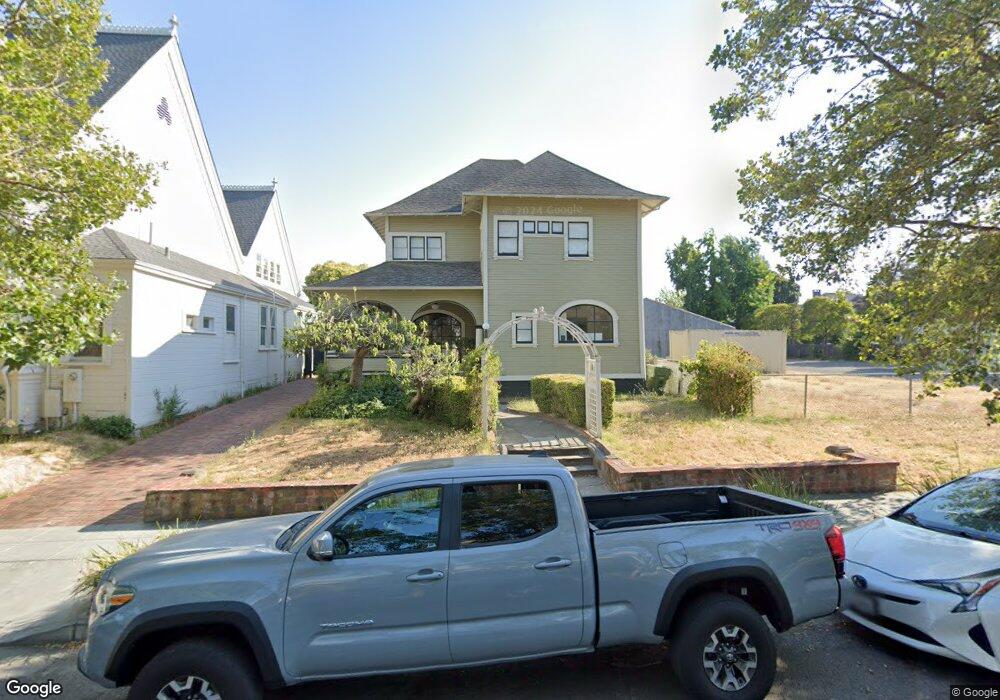
14 5th St Petaluma, CA 94952
Downtown Petaluma NeighborhoodEstimated Value: $1,142,000 - $1,320,000
5
Beds
3
Baths
2,328
Sq Ft
$531/Sq Ft
Est. Value
About This Home
This home is located at 14 5th St, Petaluma, CA 94952 and is currently estimated at $1,237,110, approximately $531 per square foot. 14 5th St is a home located in Sonoma County with nearby schools including McNear Elementary School, Petaluma Junior High School, and Petaluma High School.
Ownership History
Date
Name
Owned For
Owner Type
Purchase Details
Closed on
Oct 4, 2012
Sold by
Siders Todd and Ponsetti Sara
Bought by
Hughes Jesse and Cederna Channon
Current Estimated Value
Home Financials for this Owner
Home Financials are based on the most recent Mortgage that was taken out on this home.
Original Mortgage
$600,000
Outstanding Balance
$416,848
Interest Rate
3.58%
Mortgage Type
Purchase Money Mortgage
Estimated Equity
$820,262
Purchase Details
Closed on
Jun 25, 2008
Sold by
Wells Fargo Bank Na
Bought by
Siders Todd and Ponsetti Sara
Home Financials for this Owner
Home Financials are based on the most recent Mortgage that was taken out on this home.
Original Mortgage
$492,150
Interest Rate
5.87%
Mortgage Type
Purchase Money Mortgage
Purchase Details
Closed on
Jun 26, 2007
Sold by
Black Turk
Bought by
Wells Fargo Bank Na and Option One Mortgage Loan Trust 2005-2 As
Purchase Details
Closed on
Jan 28, 2005
Sold by
Black Julie
Bought by
Black Turk
Home Financials for this Owner
Home Financials are based on the most recent Mortgage that was taken out on this home.
Original Mortgage
$100,000
Interest Rate
5.74%
Mortgage Type
New Conventional
Purchase Details
Closed on
Dec 6, 2002
Sold by
Black Turk
Bought by
Black Turk
Home Financials for this Owner
Home Financials are based on the most recent Mortgage that was taken out on this home.
Original Mortgage
$500,000
Interest Rate
7.75%
Mortgage Type
Purchase Money Mortgage
Purchase Details
Closed on
Dec 9, 1999
Sold by
Grose James D and Grose Donna
Bought by
Black Turk
Home Financials for this Owner
Home Financials are based on the most recent Mortgage that was taken out on this home.
Original Mortgage
$68,400
Interest Rate
7.96%
Purchase Details
Closed on
Jun 7, 1999
Sold by
Thomas Formisano Robert J and Thomas Georgianna
Bought by
Black Turk and Grose James D
Home Financials for this Owner
Home Financials are based on the most recent Mortgage that was taken out on this home.
Original Mortgage
$352,500
Interest Rate
7.25%
Create a Home Valuation Report for This Property
The Home Valuation Report is an in-depth analysis detailing your home's value as well as a comparison with similar homes in the area
Home Values in the Area
Average Home Value in this Area
Purchase History
| Date | Buyer | Sale Price | Title Company |
|---|---|---|---|
| Hughes Jesse | $515,000 | Old Republic Title Company | |
| Siders Todd | $579,000 | First American Title | |
| Wells Fargo Bank Na | $118,000 | Accommodation | |
| Black Turk | -- | Chicago Title Co | |
| Black Turk | -- | Chicago Title Co | |
| Black Turk | -- | New Century Title Company | |
| Black Turk | $470,000 | First American Title |
Source: Public Records
Mortgage History
| Date | Status | Borrower | Loan Amount |
|---|---|---|---|
| Open | Hughes Jesse | $600,000 | |
| Previous Owner | Siders Todd | $492,150 | |
| Previous Owner | Black Turk | $100,000 | |
| Previous Owner | Black Turk | $500,000 | |
| Previous Owner | Black Turk | $68,400 | |
| Previous Owner | Black Turk | $352,500 |
Source: Public Records
Tax History
| Year | Tax Paid | Tax Assessment Tax Assessment Total Assessment is a certain percentage of the fair market value that is determined by local assessors to be the total taxable value of land and additions on the property. | Land | Improvement |
|---|---|---|---|---|
| 2025 | $6,897 | $634,172 | $253,667 | $380,505 |
| 2024 | $6,897 | $621,739 | $248,694 | $373,045 |
| 2023 | $6,897 | $609,549 | $243,818 | $365,731 |
| 2022 | $6,672 | $597,598 | $239,038 | $358,560 |
| 2021 | $6,547 | $585,881 | $234,351 | $351,530 |
| 2020 | $6,603 | $579,875 | $231,949 | $347,926 |
| 2019 | $6,522 | $568,505 | $227,401 | $341,104 |
| 2018 | $6,497 | $557,359 | $222,943 | $334,416 |
| 2017 | $6,362 | $546,431 | $218,572 | $327,859 |
| 2016 | $6,212 | $535,718 | $214,287 | $321,431 |
| 2015 | $6,126 | $527,672 | $211,069 | $316,603 |
| 2014 | $6,097 | $517,337 | $206,935 | $310,402 |
Source: Public Records
Map
Nearby Homes
- 131 Liberty St
- 136 Court St
- 426 1st St
- 331 Keller St Unit 6
- 519 7th St
- 712 Oak Terrace
- 301 Broadway St
- 611 Petaluma Blvd S
- 720 Petaluma Blvd S Unit 28
- 512 Kentucky St
- 100 Orchard Ln
- 510 Kent St
- 852 Western Ave
- 0 Lakeville St
- 315 Lakeville St
- 531 E Washington St
- 1309 D Street Extension
- 21 Branching Way
- 518 Galland St
- 12 Haven Dr
Your Personal Tour Guide
Ask me questions while you tour the home.