14 8th St Pittsfield, MA 01201
Estimated Value: $240,000 - $265,000
4
Beds
1
Bath
1,330
Sq Ft
$187/Sq Ft
Est. Value
About This Home
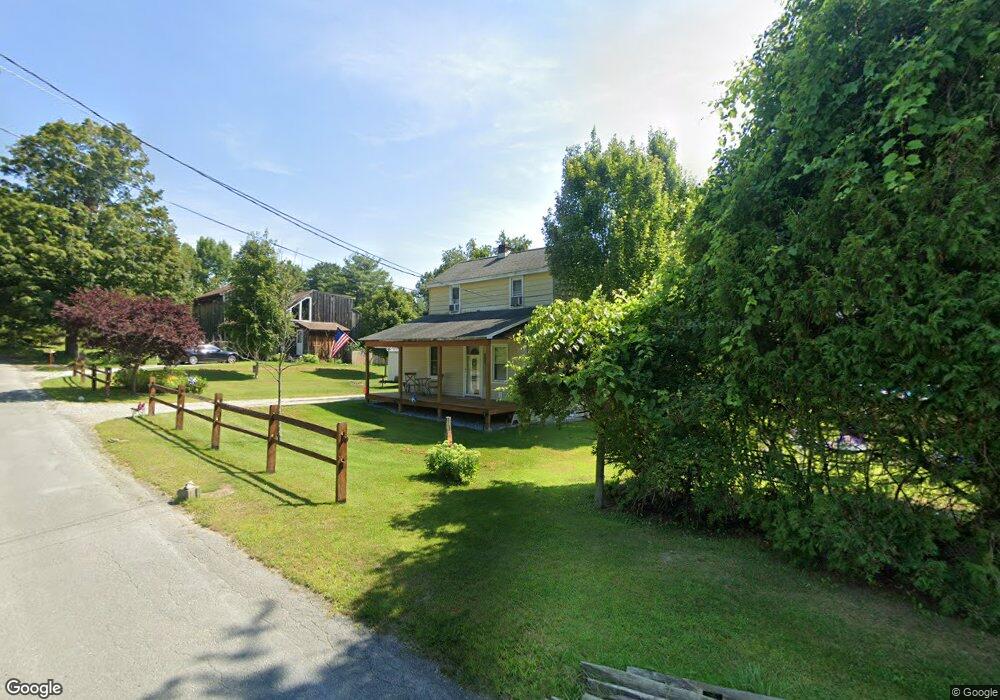
This home is located at 14 8th St, Pittsfield, MA 01201 and is currently estimated at $248,894, approximately $187 per square foot. 14 8th St is a home located in Berkshire County with nearby schools including Silvio O. Conte Community School, John T. Reid Middle School, and Taconic High School.
Ownership History
Date
Name
Owned For
Owner Type
Purchase Details
Closed on
Mar 21, 2005
Sold by
Obert Eleanor M
Bought by
Obert Kenneth E and Bernier Kim N
Current Estimated Value
Purchase Details
Closed on
Mar 18, 2005
Sold by
Obert Philip L and Obert Philip E
Bought by
Obert Eleanor M
Create a Home Valuation Report for This Property
The Home Valuation Report is an in-depth analysis detailing your home's value as well as a comparison with similar homes in the area
Home Values in the Area
Average Home Value in this Area
Purchase History
| Date | Buyer | Sale Price | Title Company |
|---|---|---|---|
| Obert Kenneth E | -- | -- | |
| Obert Kenneth E | -- | -- | |
| Obert Kenneth E | -- | -- | |
| Obert Eleanor M | -- | -- | |
| Obert Eleanor M | -- | -- | |
| Obert Eleanor M | -- | -- |
Source: Public Records
Mortgage History
| Date | Status | Borrower | Loan Amount |
|---|---|---|---|
| Previous Owner | Obert Eleanor M | $7,000 | |
| Previous Owner | Obert Eleanor M | $30,000 |
Source: Public Records
Tax History Compared to Growth
Tax History
| Year | Tax Paid | Tax Assessment Tax Assessment Total Assessment is a certain percentage of the fair market value that is determined by local assessors to be the total taxable value of land and additions on the property. | Land | Improvement |
|---|---|---|---|---|
| 2025 | $3,818 | $212,800 | $56,900 | $155,900 |
| 2024 | $3,524 | $191,000 | $56,900 | $134,100 |
| 2023 | $3,230 | $176,300 | $51,500 | $124,800 |
| 2022 | $3,244 | $155,400 | $47,500 | $107,900 |
| 2021 | $2,514 | $130,600 | $47,500 | $83,100 |
| 2020 | $2,549 | $129,300 | $47,500 | $81,800 |
| 2019 | $2,513 | $129,400 | $47,500 | $81,900 |
| 2018 | $2,561 | $128,000 | $47,500 | $80,500 |
| 2017 | $2,497 | $127,200 | $49,500 | $77,700 |
| 2016 | $2,394 | $127,600 | $49,500 | $78,100 |
| 2015 | $2,304 | $127,600 | $49,500 | $78,100 |
Source: Public Records
Map
Nearby Homes