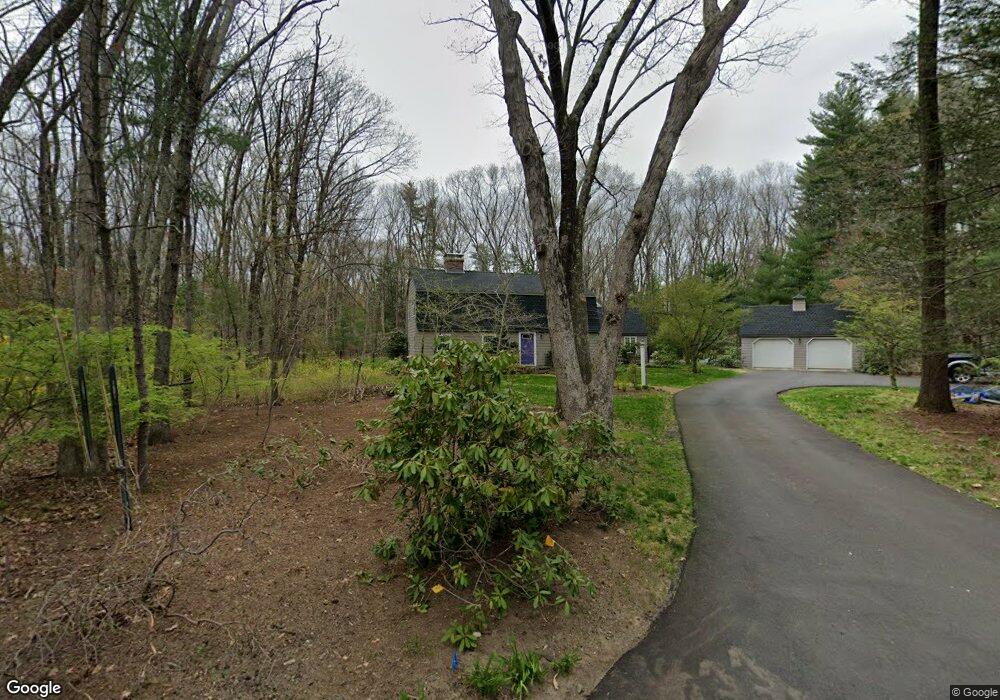
14 Adams Ln Wayland, MA 01778
Estimated Value: $1,618,000 - $2,012,000
5
Beds
4
Baths
4,863
Sq Ft
$367/Sq Ft
Est. Value
About This Home
This home is located at 14 Adams Ln, Wayland, MA 01778 and is currently estimated at $1,785,339, approximately $367 per square foot. 14 Adams Ln is a home located in Middlesex County with nearby schools including Wayland High School and Veritas Christian Academy.
Ownership History
Date
Name
Owned For
Owner Type
Purchase Details
Closed on
May 30, 2003
Sold by
Taylor Claudia D and Taylor Norman Allen
Bought by
Roy Elizabeth and Roy Randolph
Current Estimated Value
Home Financials for this Owner
Home Financials are based on the most recent Mortgage that was taken out on this home.
Original Mortgage
$460,000
Outstanding Balance
$202,671
Interest Rate
5.86%
Mortgage Type
Purchase Money Mortgage
Estimated Equity
$1,582,668
Create a Home Valuation Report for This Property
The Home Valuation Report is an in-depth analysis detailing your home's value as well as a comparison with similar homes in the area
Home Values in the Area
Average Home Value in this Area
Purchase History
| Date | Buyer | Sale Price | Title Company |
|---|---|---|---|
| Roy Elizabeth | $875,000 | -- |
Source: Public Records
Mortgage History
| Date | Status | Borrower | Loan Amount |
|---|---|---|---|
| Open | Roy Elizabeth | $460,000 |
Source: Public Records
Tax History Compared to Growth
Tax History
| Year | Tax Paid | Tax Assessment Tax Assessment Total Assessment is a certain percentage of the fair market value that is determined by local assessors to be the total taxable value of land and additions on the property. | Land | Improvement |
|---|---|---|---|---|
| 2025 | $22,381 | $1,431,900 | $691,700 | $740,200 |
| 2024 | $21,205 | $1,366,300 | $658,600 | $707,700 |
| 2023 | $19,945 | $1,197,900 | $598,500 | $599,400 |
| 2022 | $19,603 | $1,068,300 | $508,600 | $559,700 |
| 2021 | $8,016 | $1,030,200 | $470,500 | $559,700 |
| 2020 | $12,557 | $886,500 | $470,500 | $416,000 |
| 2019 | $15,147 | $828,600 | $448,100 | $380,500 |
| 2018 | $6,785 | $814,400 | $466,800 | $347,600 |
| 2017 | $14,127 | $778,800 | $444,300 | $334,500 |
| 2016 | $13,433 | $774,700 | $452,700 | $322,000 |
| 2015 | $14,019 | $762,300 | $452,700 | $309,600 |
Source: Public Records
Map
Nearby Homes
- 50 3 Ponds Rd
- 24 Claypit Hill Rd
- 14 Lundy Ln
- 156 Boston Post Rd
- 31 White Rd
- 15 Lewis Path
- 17 Glezen Ln
- 10 Hayward Rd
- 11 Wadsworth Ln Unit 11
- 17 Hastings Way Unit 17
- 19 Old Connecticut Path
- 74 Old Connecticut Path
- 2 Forest Hill Rd
- 72 Love Ln
- 82 Buckskin Dr
- 448 & 454 Concord Rd
- 23 Covered Bridge Ln
- 142 Pelham Island Rd
- 19 Warren Ln
- 42 Westerly Rd