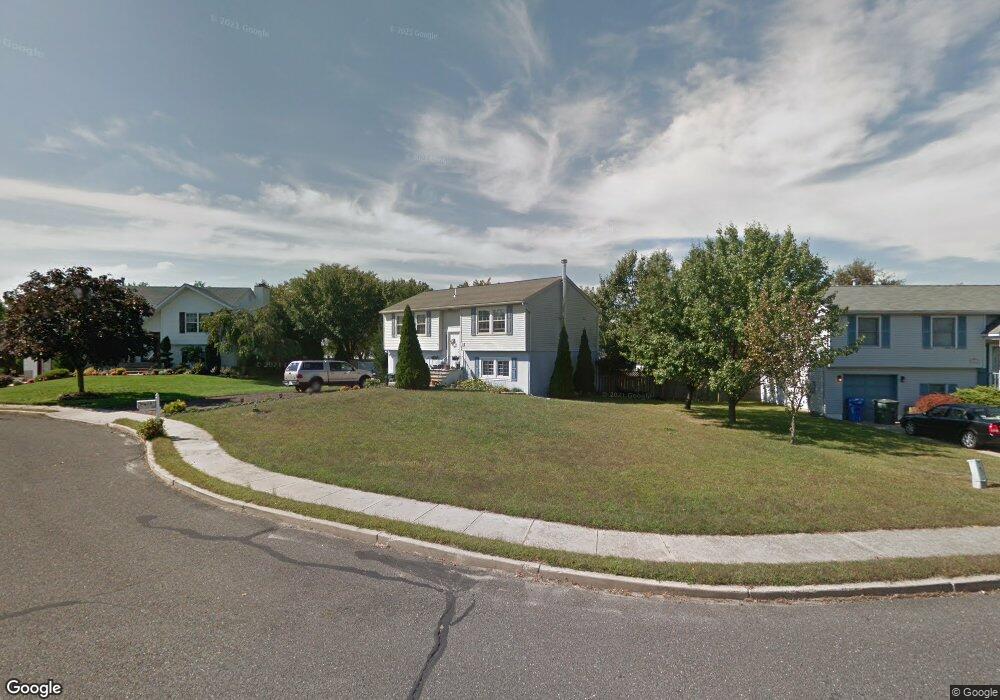
14 Alfred Ct Glassboro, NJ 08028
Estimated Value: $264,000 - $360,000
--
Bed
--
Bath
1,598
Sq Ft
$199/Sq Ft
Est. Value
About This Home
This home is located at 14 Alfred Ct, Glassboro, NJ 08028 and is currently estimated at $318,647, approximately $199 per square foot. 14 Alfred Ct is a home located in Gloucester County with nearby schools including J Harvey Rodgers School, Dorothy L Bullock Elementary, and Glassboro Intermediate School.
Ownership History
Date
Name
Owned For
Owner Type
Purchase Details
Closed on
Jan 23, 2009
Sold by
Boogaard Edwin C
Bought by
Boogaard Edwin C and Boogaard Darcel J
Current Estimated Value
Home Financials for this Owner
Home Financials are based on the most recent Mortgage that was taken out on this home.
Original Mortgage
$111,000
Outstanding Balance
$70,460
Interest Rate
5.26%
Mortgage Type
New Conventional
Estimated Equity
$248,187
Purchase Details
Closed on
Oct 25, 1994
Sold by
Federal Home Loan Mortgage Corporation
Bought by
Boogaard Edwin C
Create a Home Valuation Report for This Property
The Home Valuation Report is an in-depth analysis detailing your home's value as well as a comparison with similar homes in the area
Home Values in the Area
Average Home Value in this Area
Purchase History
| Date | Buyer | Sale Price | Title Company |
|---|---|---|---|
| Boogaard Edwin C | -- | United Title & Abstract | |
| Boogaard Edwin C | $82,500 | Weichert Title Agency |
Source: Public Records
Mortgage History
| Date | Status | Borrower | Loan Amount |
|---|---|---|---|
| Open | Boogaard Edwin C | $111,000 |
Source: Public Records
Tax History Compared to Growth
Tax History
| Year | Tax Paid | Tax Assessment Tax Assessment Total Assessment is a certain percentage of the fair market value that is determined by local assessors to be the total taxable value of land and additions on the property. | Land | Improvement |
|---|---|---|---|---|
| 2025 | $6,178 | $175,500 | $70,100 | $105,400 |
| 2024 | $6,141 | $175,500 | $70,100 | $105,400 |
| 2023 | $6,141 | $175,500 | $70,100 | $105,400 |
| 2022 | $6,079 | $175,500 | $70,100 | $105,400 |
| 2021 | $6,167 | $175,500 | $70,100 | $105,400 |
| 2020 | $6,218 | $175,500 | $70,100 | $105,400 |
| 2019 | $6,229 | $175,500 | $70,100 | $105,400 |
| 2018 | $6,232 | $175,500 | $70,100 | $105,400 |
| 2017 | $6,262 | $175,500 | $70,100 | $105,400 |
| 2016 | $6,081 | $175,500 | $70,100 | $105,400 |
| 2015 | $5,949 | $175,500 | $70,100 | $105,400 |
| 2014 | $5,814 | $175,500 | $70,100 | $105,400 |
Source: Public Records
Map
Nearby Homes