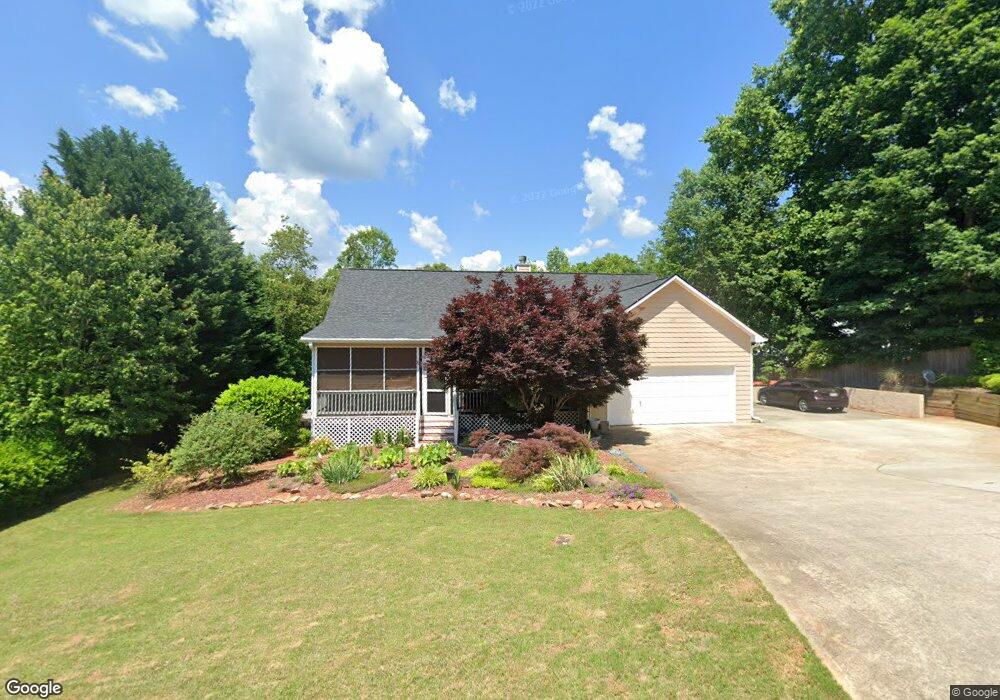
14 Alta Mont Ct Unit 8 Dahlonega, GA 30533
Estimated Value: $430,000 - $518,000
5
Beds
3
Baths
5,063
Sq Ft
$94/Sq Ft
Est. Value
About This Home
This home is located at 14 Alta Mont Ct Unit 8, Dahlonega, GA 30533 and is currently estimated at $475,255, approximately $93 per square foot. 14 Alta Mont Ct Unit 8 is a home located in Lumpkin County with nearby schools including Clay County Middle School and Lumpkin County High School.
Ownership History
Date
Name
Owned For
Owner Type
Purchase Details
Closed on
Mar 22, 2019
Sold by
Medon Gregory
Bought by
Smith Susan Darlene and Rodriguez Efrain
Current Estimated Value
Home Financials for this Owner
Home Financials are based on the most recent Mortgage that was taken out on this home.
Original Mortgage
$193,200
Outstanding Balance
$169,510
Interest Rate
4.3%
Mortgage Type
New Conventional
Estimated Equity
$305,745
Purchase Details
Closed on
Nov 25, 2013
Sold by
Chumley Priscilla K
Bought by
Medon Gregory and Medon Jody
Purchase Details
Closed on
Feb 21, 2013
Sold by
Chumley Steven Lamar and Chumley Priscil
Bought by
Chumley Steven Lamar and Chumley Priscilla K
Purchase Details
Closed on
Mar 11, 2003
Sold by
Biggs Ben Paul and Biggs Kat
Bought by
Chumley Steven Lamar and Chumley Priscilla K
Purchase Details
Closed on
Aug 30, 1999
Bought by
Biggs Ben Paul and Biggs Kat
Create a Home Valuation Report for This Property
The Home Valuation Report is an in-depth analysis detailing your home's value as well as a comparison with similar homes in the area
Home Values in the Area
Average Home Value in this Area
Purchase History
| Date | Buyer | Sale Price | Title Company |
|---|---|---|---|
| Smith Susan Darlene | $241,500 | -- | |
| Medon Gregory | $205,000 | -- | |
| Chumley Steven Lamar | -- | -- | |
| Chumley Steven Lamar | $164,900 | -- | |
| Biggs Ben Paul | $190,000 | -- |
Source: Public Records
Mortgage History
| Date | Status | Borrower | Loan Amount |
|---|---|---|---|
| Open | Smith Susan Darlene | $193,200 |
Source: Public Records
Tax History Compared to Growth
Tax History
| Year | Tax Paid | Tax Assessment Tax Assessment Total Assessment is a certain percentage of the fair market value that is determined by local assessors to be the total taxable value of land and additions on the property. | Land | Improvement |
|---|---|---|---|---|
| 2024 | $642 | $130,217 | $10,000 | $120,217 |
| 2023 | $2,994 | $123,592 | $10,000 | $113,592 |
| 2022 | $3,341 | $111,080 | $10,000 | $101,080 |
| 2021 | $3,055 | $95,311 | $10,000 | $85,311 |
| 2020 | $3,114 | $93,548 | $10,000 | $83,548 |
| 2019 | $505 | $93,548 | $10,000 | $83,548 |
| 2018 | $346 | $83,040 | $10,000 | $73,040 |
| 2017 | $327 | $81,598 | $10,000 | $71,598 |
| 2016 | $245 | $77,085 | $10,000 | $67,085 |
| 2015 | $187 | $77,085 | $10,000 | $67,085 |
| 2014 | $187 | $77,527 | $10,000 | $67,527 |
| 2013 | -- | $78,294 | $10,000 | $68,294 |
Source: Public Records
Map
Nearby Homes
- 114 Funaro Ln
- 0 Dawsonville Hwy Unit 10631159
- 00 Dawsonville Hwy
- 1047 Nugget Ct
- 253 Blair Ridge Rd
- 120 Blair Ridge Rd
- 121 Blair Ridge Rd
- 549 Ivy Terrace
- 490 N Hall Rd
- 132 J Mountain Dr
- 1202 Oak Grove Rd
- 735 Calhoun Rd
- 399 N Chestatee St
- 168 W Main St
- 315 Church St
- 120 Sanders Blvd
- 99 Madeline Anthony Road Lots 44 and 45
- 100 Sanders Blvd
- 99 Madeline Anthony Rd
- 0 Crown Mountain Unit 7682225
- 14 Alta Mont Ct
- 87 Alta Vista Rd
- 87 Alta Vista Rd Unit 9
- 28 Alta Mont Ct
- 14 14 Alta Mont Ct
- 0 Altavista Dr Unit 3177001
- 0 Altavista Dr Unit 8028694
- 0 Altavista Dr Unit 3274973
- 0 Altavista Dr Unit 7491704
- 0 Altavista Dr
- 9 Alta Mont Ct
- 107 Alta Vista Rd
- 76 Altavista Dr
- 0 Alta Mont Ct Unit 8163298
- 0 Alta Mont Ct Unit 9003267
- 0 Alta Mont Ct Unit 3258826
- 0 Alta Mont Ct Unit 3263938
- 0 Alta Mont Ct
- 31 Alta Mont Ct
- 61 Alta Vista Rd