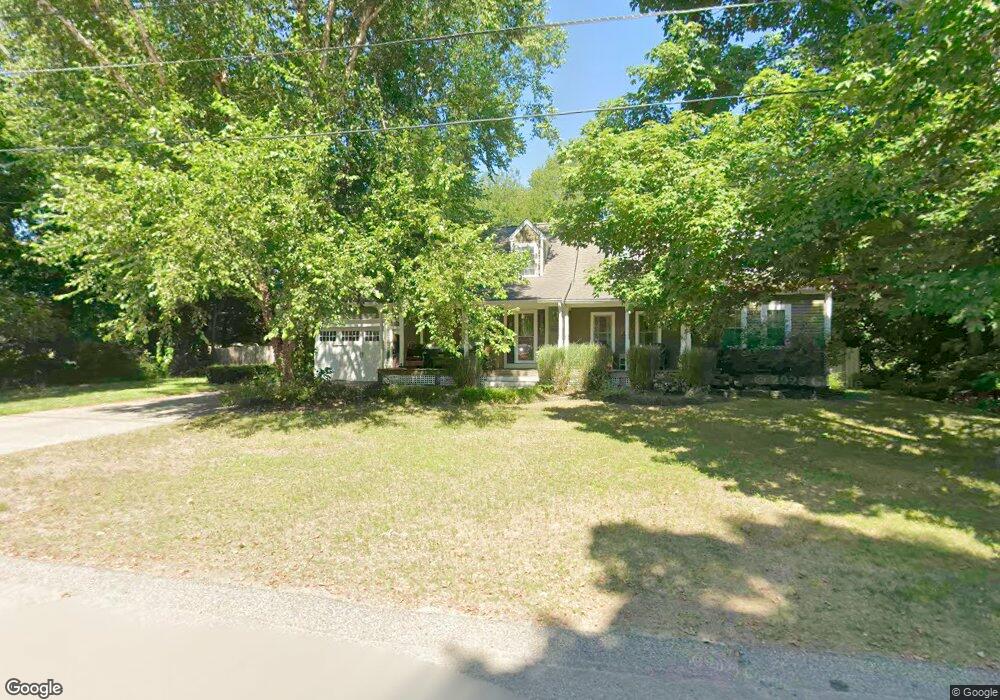
14 Atlantic Rd North Attleboro, MA 02760
North Attleboro NeighborhoodEstimated Value: $751,000 - $823,000
4
Beds
3
Baths
2,246
Sq Ft
$350/Sq Ft
Est. Value
About This Home
This home is located at 14 Atlantic Rd, North Attleboro, MA 02760 and is currently estimated at $787,026, approximately $350 per square foot. 14 Atlantic Rd is a home located in Bristol County with nearby schools including North Attleboro High School, Cadence Academy Preschool - North Attleborough, and St John The Evangelist School.
Ownership History
Date
Name
Owned For
Owner Type
Purchase Details
Closed on
Dec 9, 2021
Sold by
Myers Kelly A and Myers Richard A
Bought by
R & K Myers Rt
Current Estimated Value
Purchase Details
Closed on
Apr 1, 1993
Sold by
Fisher Stephen E and Fisher Marie D
Bought by
Myers Kelly A and Myers Richard A
Home Financials for this Owner
Home Financials are based on the most recent Mortgage that was taken out on this home.
Original Mortgage
$109,000
Interest Rate
7.6%
Mortgage Type
Purchase Money Mortgage
Purchase Details
Closed on
Jan 6, 1993
Sold by
Walsh Patrick J and Walsh John G
Bought by
Fisher Stephen B and Fisher Marie D
Home Financials for this Owner
Home Financials are based on the most recent Mortgage that was taken out on this home.
Original Mortgage
$120,000
Interest Rate
8.24%
Mortgage Type
Purchase Money Mortgage
Create a Home Valuation Report for This Property
The Home Valuation Report is an in-depth analysis detailing your home's value as well as a comparison with similar homes in the area
Home Values in the Area
Average Home Value in this Area
Purchase History
| Date | Buyer | Sale Price | Title Company |
|---|---|---|---|
| R & K Myers Rt | -- | None Available | |
| Myers Kelly A | $149,900 | -- | |
| Fisher Stephen B | $58,000 | -- |
Source: Public Records
Mortgage History
| Date | Status | Borrower | Loan Amount |
|---|---|---|---|
| Previous Owner | Fisher Stephen B | $103,000 | |
| Previous Owner | Fisher Stephen B | $109,000 | |
| Previous Owner | Fisher Stephen B | $120,000 |
Source: Public Records
Tax History Compared to Growth
Tax History
| Year | Tax Paid | Tax Assessment Tax Assessment Total Assessment is a certain percentage of the fair market value that is determined by local assessors to be the total taxable value of land and additions on the property. | Land | Improvement |
|---|---|---|---|---|
| 2025 | $8,017 | $680,000 | $145,200 | $534,800 |
| 2024 | $7,231 | $626,600 | $145,200 | $481,400 |
| 2023 | $7,283 | $569,400 | $145,200 | $424,200 |
| 2022 | $6,670 | $478,800 | $145,200 | $333,600 |
| 2021 | $6,233 | $436,800 | $145,200 | $291,600 |
| 2020 | $6,060 | $422,300 | $145,200 | $277,100 |
| 2019 | $5,873 | $412,400 | $132,100 | $280,300 |
| 2018 | $5,207 | $390,300 | $132,100 | $258,200 |
| 2017 | $4,803 | $363,300 | $132,100 | $231,200 |
| 2016 | $4,800 | $363,100 | $146,800 | $216,300 |
| 2015 | $4,360 | $331,800 | $146,800 | $185,000 |
| 2014 | $4,091 | $309,000 | $128,800 | $180,200 |
Source: Public Records
Map
Nearby Homes