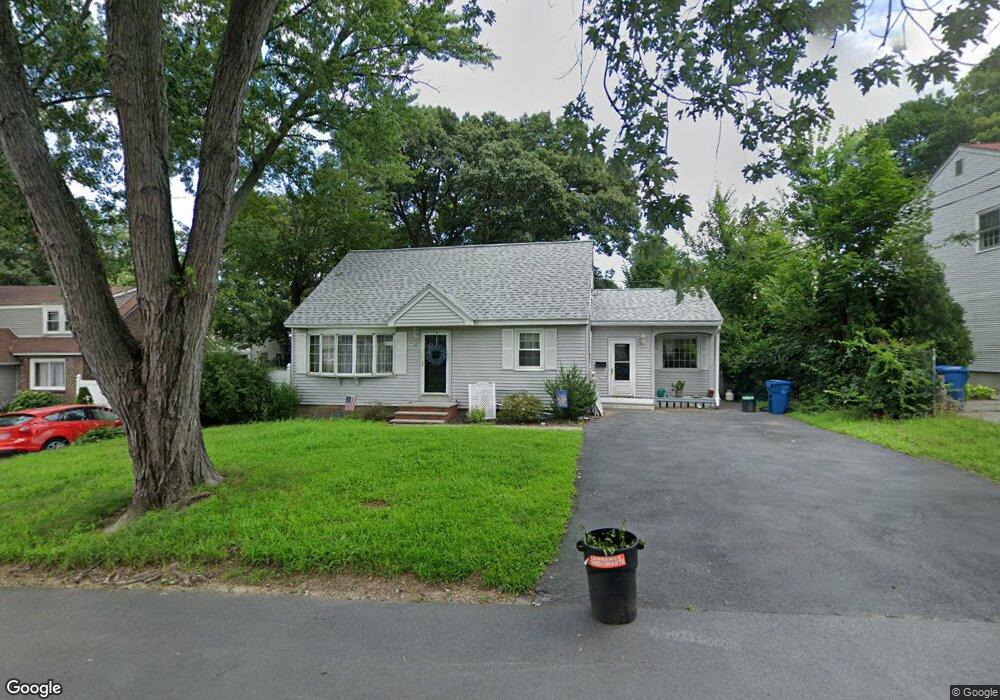
14 Ayer Rd Lawrence, MA 01843
Mount Vernon NeighborhoodEstimated Value: $518,000 - $650,000
3
Beds
2
Baths
1,499
Sq Ft
$383/Sq Ft
Est. Value
About This Home
This home is located at 14 Ayer Rd, Lawrence, MA 01843 and is currently estimated at $574,809, approximately $383 per square foot. 14 Ayer Rd is a home located in Essex County with nearby schools including John Breen School, School For Exceptional Studies, and Robert Frost Middle School.
Ownership History
Date
Name
Owned For
Owner Type
Purchase Details
Closed on
Jun 13, 2014
Sold by
Moore Susan
Bought by
Susan Moore Irt and Corrigan Brian T
Current Estimated Value
Purchase Details
Closed on
Jun 7, 1991
Sold by
Fhlmc
Bought by
Moore Susan
Home Financials for this Owner
Home Financials are based on the most recent Mortgage that was taken out on this home.
Original Mortgage
$72,000
Interest Rate
9.42%
Mortgage Type
Purchase Money Mortgage
Purchase Details
Closed on
Nov 13, 1987
Sold by
Laplume Ronald M
Bought by
Magoon Pauline T
Home Financials for this Owner
Home Financials are based on the most recent Mortgage that was taken out on this home.
Original Mortgage
$95,700
Interest Rate
11.13%
Mortgage Type
Purchase Money Mortgage
Create a Home Valuation Report for This Property
The Home Valuation Report is an in-depth analysis detailing your home's value as well as a comparison with similar homes in the area
Home Values in the Area
Average Home Value in this Area
Purchase History
| Date | Buyer | Sale Price | Title Company |
|---|---|---|---|
| Susan Moore Irt | -- | -- | |
| Moore Susan | $103,000 | -- | |
| Magoon Pauline T | $140,000 | -- |
Source: Public Records
Mortgage History
| Date | Status | Borrower | Loan Amount |
|---|---|---|---|
| Previous Owner | Magoon Pauline T | $71,000 | |
| Previous Owner | Magoon Pauline T | $72,000 | |
| Previous Owner | Magoon Pauline T | $95,700 |
Source: Public Records
Tax History Compared to Growth
Tax History
| Year | Tax Paid | Tax Assessment Tax Assessment Total Assessment is a certain percentage of the fair market value that is determined by local assessors to be the total taxable value of land and additions on the property. | Land | Improvement |
|---|---|---|---|---|
| 2025 | $4,283 | $486,700 | $170,200 | $316,500 |
| 2024 | $3,895 | $421,100 | $143,700 | $277,400 |
| 2023 | $4,028 | $396,500 | $128,200 | $268,300 |
| 2022 | $3,892 | $340,200 | $119,000 | $221,200 |
| 2021 | $3,639 | $296,600 | $116,200 | $180,400 |
| 2020 | $3,413 | $274,600 | $100,700 | $173,900 |
| 2019 | $3,486 | $254,800 | $100,400 | $154,400 |
| 2018 | $3,256 | $227,400 | $96,000 | $131,400 |
| 2017 | $3,140 | $204,700 | $95,100 | $109,600 |
| 2016 | $3,080 | $198,600 | $88,000 | $110,600 |
| 2015 | $3,003 | $198,600 | $88,000 | $110,600 |
Source: Public Records
Map
Nearby Homes
- 34 Leeds Terrace
- 102 Weare St
- 24 Inman St Unit 4
- 5 Lafayette Ave
- 341 S Broadway- Parcel II
- 11 W Hawley St
- 42 Beresford St
- 40 Chester St
- 31 Garfield St
- 49 Bowdoin St Unit 51
- 27-29 Dorchester St
- 54 Amherst St
- 356-360 S Union St
- 143 Foster St
- 91-93 Newton St
- 96 Beacon St
- 12-12A Durham St
- 21 Clubview Dr Unit 21
- 41 Durham St
- 354 N Main St Unit 214