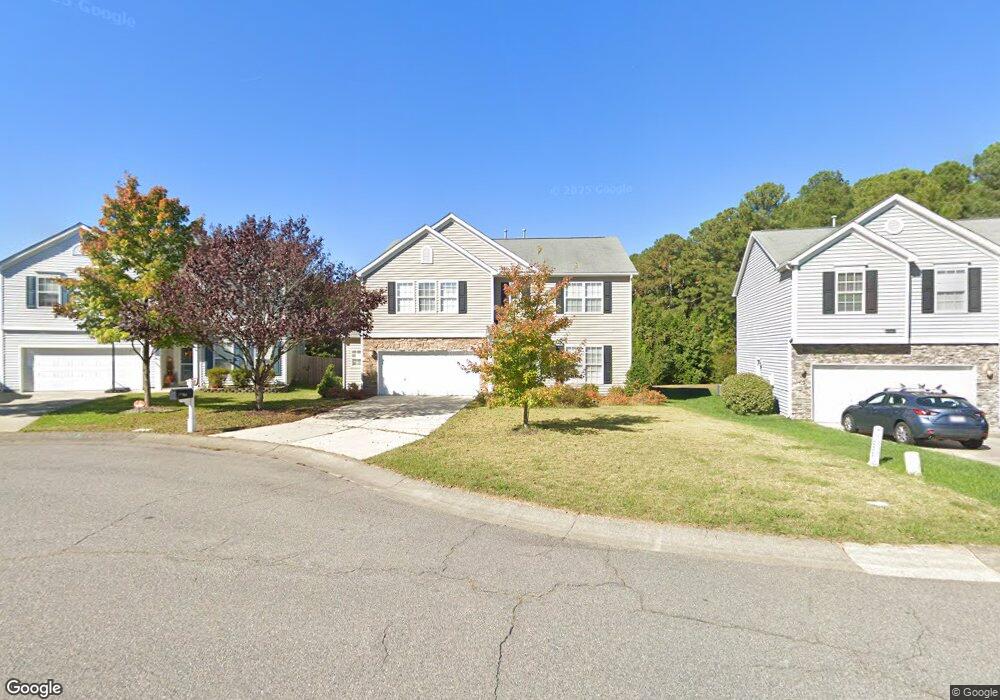
14 Beaver Creek Ln Durham, NC 27703
South Durham NeighborhoodEstimated Value: $474,000 - $529,916
About This Home
This home is located at 14 Beaver Creek Ln, Durham, NC 27703 and is currently estimated at $505,229, approximately $175 per square foot. 14 Beaver Creek Ln is a home located in Durham County with nearby schools including Bethesda Elementary School, John W Neal Middle School, and Southern School of Energy & Sustainability.
Ownership History
We collect this data history from publicly available records. To have your information removed, we recommend requesting removal directly through your county’s website.
Purchase Details
Home Financials for this Owner
Home Financials are based on the most recent Mortgage that was taken out on this home.Purchase Details
Home Financials for this Owner
Home Financials are based on the most recent Mortgage that was taken out on this home.Purchase Details
Home Financials for this Owner
Home Financials are based on the most recent Mortgage that was taken out on this home.Home Values in the Area
Average Home Value in this Area
Purchase History
We collect this data history from publicly available records. To have your information removed, we recommend requesting removal directly through your county’s website.
| Date | Buyer | Sale Price | Title Company |
|---|---|---|---|
| $265,000 | -- | ||
| $242,000 | None Available | ||
| $236,000 | -- |
Mortgage History
We collect this data history from publicly available records. To have your information removed, we recommend requesting removal directly through your county’s website.
| Date | Status | Borrower | Loan Amount |
|---|---|---|---|
| Open | $244,900 | ||
| Previous Owner | $237,616 | ||
| Previous Owner | $188,450 |
Tax History
We collect this data history from publicly available records. To have your information removed, we recommend requesting removal directly through your county’s website.
| Year | Tax Paid | Tax Assessment Tax Assessment Total Assessment is a certain percentage of the fair market value that is determined by local assessors to be the total taxable value of land and additions on the property. | Land | Improvement |
|---|---|---|---|---|
| 2025 | $5,551 | $559,974 | $119,000 | $440,974 |
| 2024 | $4,122 | $295,493 | $53,370 | $242,123 |
| 2023 | $3,871 | $295,493 | $53,370 | $242,123 |
| 2022 | $3,782 | $295,493 | $53,370 | $242,123 |
| 2021 | $3,764 | $295,493 | $53,370 | $242,123 |
| 2020 | $3,676 | $295,493 | $53,370 | $242,123 |
| 2019 | $3,676 | $295,493 | $53,370 | $242,123 |
| 2018 | $3,475 | $256,204 | $41,510 | $214,694 |
| 2017 | $3,450 | $256,204 | $41,510 | $214,694 |
| 2016 | $3,333 | $256,204 | $41,510 | $214,694 |
| 2015 | $3,490 | $252,136 | $41,933 | $210,203 |
| 2014 | $3,490 | $252,136 | $41,933 | $210,203 |
Map
- 4 Beaver Creek Ln
- 1804 Cedar Grove Dr
- 9 Bellmore Ct
- 2214 Tw Alexander Dr
- 2805 Lenox Ln
- 3310 Forest Grove Ct
- 2709 Hidden Hollow Dr
- 12 Sameer Ct
- 2603 Oleander Dr
- 3508 Appling Way
- 5101 Suda Dr
- 1725 Tw Alexander Dr Unit 1103
- 5108 Suda Dr
- 1907 Raj Dr
- 4 Gandhi Dr
- 2421 Bonnie Brae Rd
- 105 Journey Place
- 402 Brier Summit Place
- 1812 Shiva Ct
- 237 Westgrove Ct
- 16 Beaver Creek Ln
- 12 Beaver Creek Ln
- 14 Alexis Ct
- 12 Alexis Ct
- 10 Beaver Creek Ln
- 16 Alexis Ct
- 18 Beaver Creek Ln
- 9 Beaver Creek Ln
- 17 Beaver Creek Ln
- 13 Beaver Creek Ln
- 15 Beaver Creek Ln
- 8 Beaver Creek Ln
- 10 Alexis Ct
- 15 Alexis Ct
- 8 Alexis Ct
- 2006 Cedar Grove Dr
- 2008 Cedar Grove Dr
- 2002 Cedar Grove Dr
- 2110 Cedar Grove Dr
- 2010 Cedar Grove Dr
Ask me questions while you tour the home.