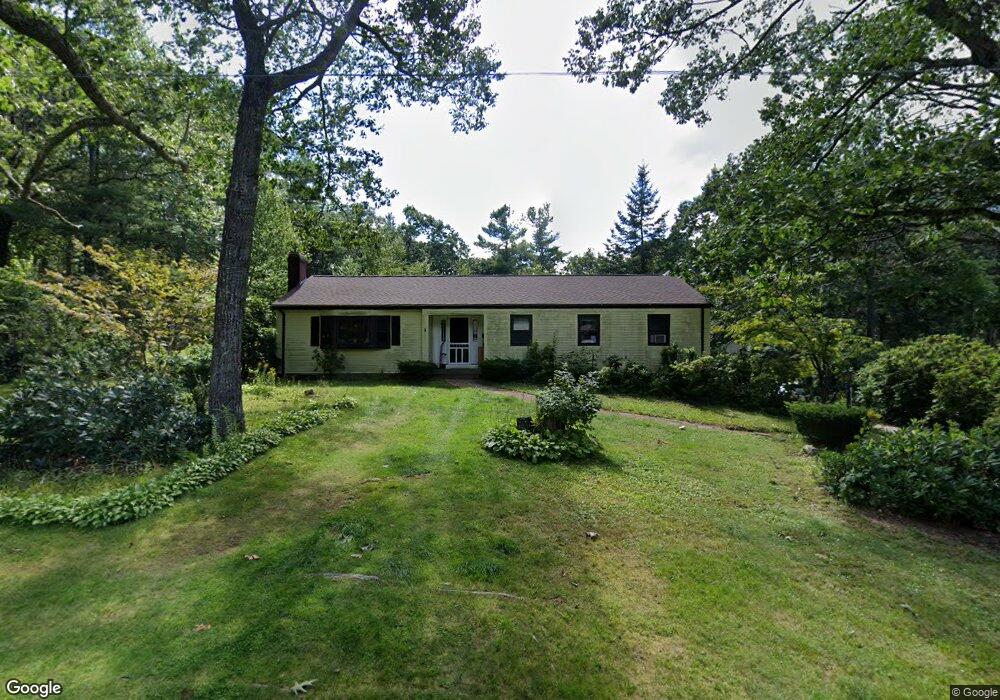
14 Bel Arbor Dr Paxton, MA 01612
Estimated Value: $459,000 - $521,000
3
Beds
2
Baths
1,501
Sq Ft
$318/Sq Ft
Est. Value
About This Home
This home is located at 14 Bel Arbor Dr, Paxton, MA 01612 and is currently estimated at $477,254, approximately $317 per square foot. 14 Bel Arbor Dr is a home located in Worcester County with nearby schools including Wachusett Regional High School and Holden Christian Academy.
Ownership History
Date
Name
Owned For
Owner Type
Purchase Details
Closed on
May 1, 2019
Sold by
Vasseur Kimberly and Vasseur Kimberly A
Bought by
Vasseur Kimberly A and Lovejoy Pamela J
Current Estimated Value
Home Financials for this Owner
Home Financials are based on the most recent Mortgage that was taken out on this home.
Original Mortgage
$229,191
Outstanding Balance
$200,683
Interest Rate
4%
Mortgage Type
FHA
Estimated Equity
$276,571
Purchase Details
Closed on
Oct 21, 2015
Sold by
Vasseur Harvey Est
Bought by
Vasseur Kimberly
Purchase Details
Closed on
Jan 1, 1980
Bought by
Vasseur Kimberly
Create a Home Valuation Report for This Property
The Home Valuation Report is an in-depth analysis detailing your home's value as well as a comparison with similar homes in the area
Home Values in the Area
Average Home Value in this Area
Purchase History
| Date | Buyer | Sale Price | Title Company |
|---|---|---|---|
| Vasseur Kimberly A | -- | -- | |
| Vasseur Kimberly | -- | -- | |
| Vasseur Kimberly | -- | -- |
Source: Public Records
Mortgage History
| Date | Status | Borrower | Loan Amount |
|---|---|---|---|
| Open | Vasseur Kimberly A | $229,191 |
Source: Public Records
Tax History Compared to Growth
Tax History
| Year | Tax Paid | Tax Assessment Tax Assessment Total Assessment is a certain percentage of the fair market value that is determined by local assessors to be the total taxable value of land and additions on the property. | Land | Improvement |
|---|---|---|---|---|
| 2025 | $5,931 | $402,400 | $104,200 | $298,200 |
| 2024 | $5,911 | $367,800 | $104,200 | $263,600 |
| 2023 | $5,947 | $338,300 | $94,700 | $243,600 |
| 2022 | $5,846 | $308,000 | $94,700 | $213,300 |
| 2021 | $6,333 | $284,500 | $86,300 | $198,200 |
| 2020 | $5,459 | $276,700 | $78,500 | $198,200 |
| 2019 | $5,353 | $271,200 | $71,300 | $199,900 |
| 2018 | $4,758 | $232,900 | $67,800 | $165,100 |
| 2017 | $4,459 | $218,700 | $64,600 | $154,100 |
| 2016 | $4,363 | $211,900 | $64,600 | $147,300 |
| 2015 | $4,297 | $206,700 | $64,600 | $142,100 |
| 2014 | $4,168 | $203,200 | $64,600 | $138,600 |
Source: Public Records
Map
Nearby Homes