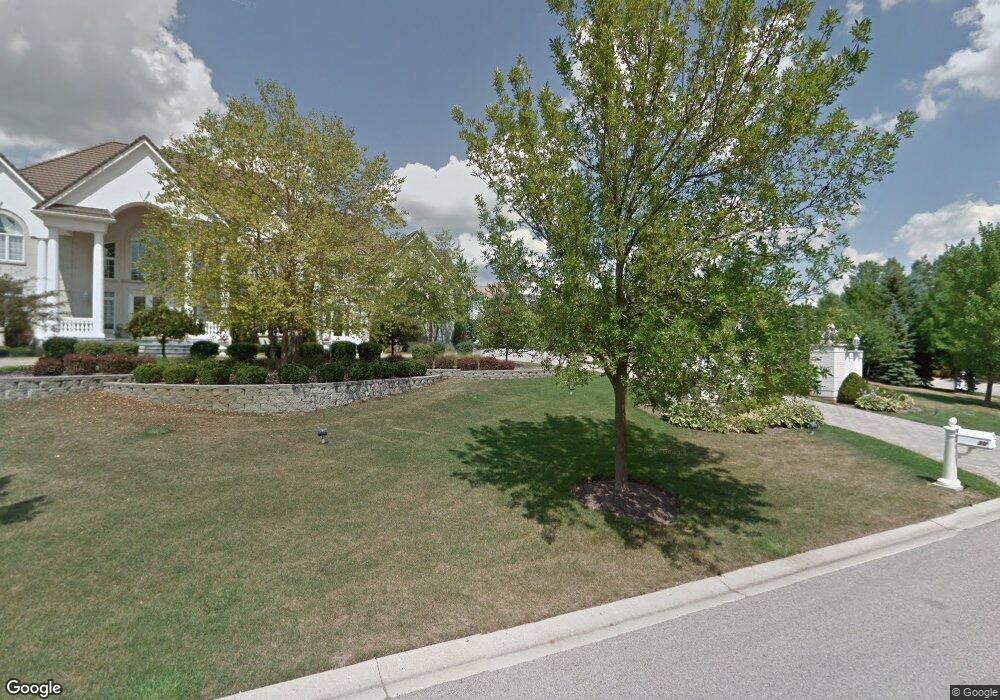
14 Blossom Ct South Barrington, IL 60010
Estimated Value: $1,740,610 - $3,401,000
5
Beds
9
Baths
10,000
Sq Ft
$278/Sq Ft
Est. Value
About This Home
This home is located at 14 Blossom Ct, South Barrington, IL 60010 and is currently estimated at $2,783,870, approximately $278 per square foot. 14 Blossom Ct is a home located in Cook County with nearby schools including Barbara B. Rose Elementary School, Barrington Mdle School- Prairie Cmps, and Barrington High School.
Ownership History
Date
Name
Owned For
Owner Type
Purchase Details
Closed on
Oct 27, 2008
Sold by
Morelli Raymond and Morelli Katina
Bought by
Chicago Title Land Trust Company and Trust #8002351216
Current Estimated Value
Home Financials for this Owner
Home Financials are based on the most recent Mortgage that was taken out on this home.
Original Mortgage
$1,250,000
Outstanding Balance
$837,376
Interest Rate
6.5%
Mortgage Type
Unknown
Estimated Equity
$1,946,494
Purchase Details
Closed on
Jun 19, 1995
Sold by
Parkway Bank & Trust Company
Bought by
Morelli Raymond and Morelli Katina
Create a Home Valuation Report for This Property
The Home Valuation Report is an in-depth analysis detailing your home's value as well as a comparison with similar homes in the area
Home Values in the Area
Average Home Value in this Area
Purchase History
| Date | Buyer | Sale Price | Title Company |
|---|---|---|---|
| Chicago Title Land Trust Company | $2,525,000 | First American Title | |
| Morelli Raymond | $260,000 | -- |
Source: Public Records
Mortgage History
| Date | Status | Borrower | Loan Amount |
|---|---|---|---|
| Open | Chicago Title Land Trust Company | $1,250,000 |
Source: Public Records
Tax History Compared to Growth
Tax History
| Year | Tax Paid | Tax Assessment Tax Assessment Total Assessment is a certain percentage of the fair market value that is determined by local assessors to be the total taxable value of land and additions on the property. | Land | Improvement |
|---|---|---|---|---|
| 2024 | $25,278 | $103,150 | $22,947 | $80,203 |
| 2023 | $24,550 | $114,846 | $22,947 | $91,899 |
| 2022 | $24,550 | $114,846 | $22,947 | $91,899 |
| 2021 | $23,255 | $96,810 | $17,210 | $79,600 |
| 2020 | $23,400 | $100,259 | $17,210 | $83,049 |
| 2019 | $22,874 | $111,523 | $17,210 | $94,313 |
| 2018 | $25,756 | $121,708 | $15,776 | $105,932 |
| 2017 | $26,980 | $130,686 | $15,776 | $114,910 |
| 2016 | $25,610 | $130,686 | $15,776 | $114,910 |
| 2015 | $25,007 | $118,388 | $14,342 | $104,046 |
| 2014 | $24,876 | $118,388 | $14,342 | $104,046 |
| 2013 | $25,159 | $125,254 | $14,342 | $110,912 |
Source: Public Records
Map
Nearby Homes