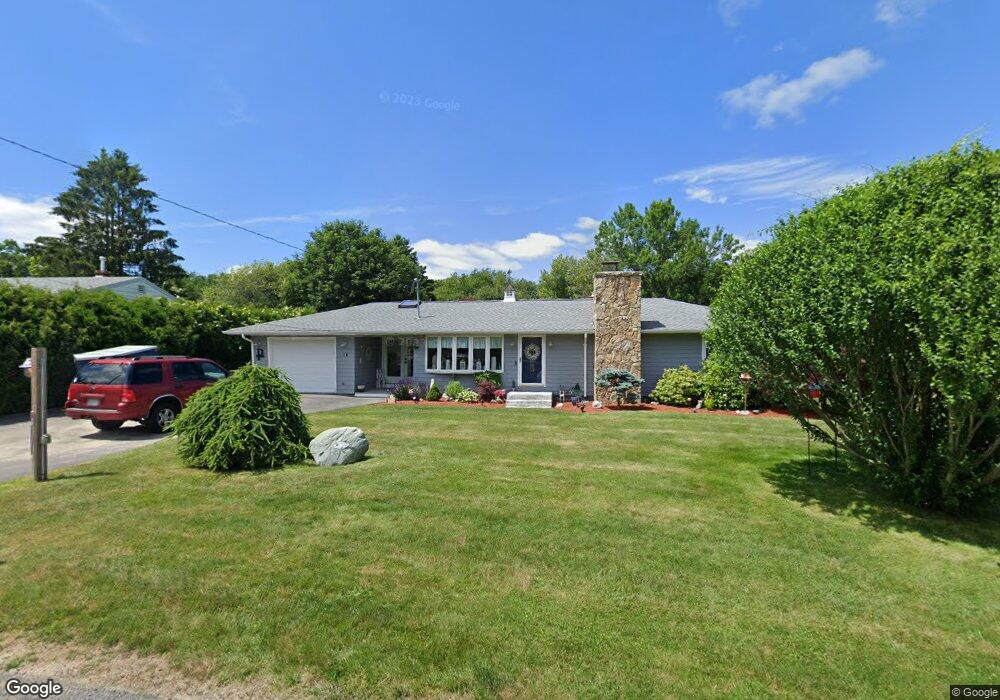
14 Bob St Westport, MA 02790
North Westport NeighborhoodEstimated Value: $473,628 - $536,000
2
Beds
--
Bath
1,324
Sq Ft
$378/Sq Ft
Est. Value
About This Home
This home is located at 14 Bob St, Westport, MA 02790 and is currently estimated at $500,907, approximately $378 per square foot. 14 Bob St is a home located in Bristol County with nearby schools including Alice A. Macomber Primary School, Westport Elementary School, and Westport Middle-High School.
Ownership History
Date
Name
Owned For
Owner Type
Purchase Details
Closed on
Jul 15, 2025
Sold by
Pagnozzi Michael A and Pagnozzi Dianna L
Bought by
Pagnozzi Income-Only Ft and Costa
Current Estimated Value
Purchase Details
Closed on
Aug 31, 2018
Sold by
Raposa Ft
Bought by
Pagnozzi Michael A and Pagnozzi Dianna L
Home Financials for this Owner
Home Financials are based on the most recent Mortgage that was taken out on this home.
Original Mortgage
$248,000
Interest Rate
4.25%
Mortgage Type
New Conventional
Create a Home Valuation Report for This Property
The Home Valuation Report is an in-depth analysis detailing your home's value as well as a comparison with similar homes in the area
Home Values in the Area
Average Home Value in this Area
Purchase History
| Date | Buyer | Sale Price | Title Company |
|---|---|---|---|
| Pagnozzi Income-Only Ft | -- | -- | |
| Pagnozzi Income-Only Ft | -- | -- | |
| Pagnozzi Michael A | $310,000 | -- | |
| Pagnozzi Michael A | $310,000 | -- |
Source: Public Records
Mortgage History
| Date | Status | Borrower | Loan Amount |
|---|---|---|---|
| Previous Owner | Pagnozzi Michael A | $248,000 |
Source: Public Records
Tax History Compared to Growth
Tax History
| Year | Tax Paid | Tax Assessment Tax Assessment Total Assessment is a certain percentage of the fair market value that is determined by local assessors to be the total taxable value of land and additions on the property. | Land | Improvement |
|---|---|---|---|---|
| 2025 | $2,971 | $398,800 | $157,900 | $240,900 |
| 2024 | $2,968 | $383,900 | $146,300 | $237,600 |
| 2023 | $2,809 | $344,300 | $133,300 | $211,000 |
| 2022 | $2,551 | $300,800 | $121,200 | $179,600 |
| 2021 | $2,497 | $289,700 | $110,100 | $179,600 |
| 2020 | $2,405 | $285,300 | $105,700 | $179,600 |
| 2019 | $2,311 | $279,400 | $105,700 | $173,700 |
| 2018 | $2,208 | $270,300 | $112,900 | $157,400 |
| 2017 | $2,122 | $266,300 | $112,900 | $153,400 |
| 2016 | $1,995 | $252,200 | $112,900 | $139,300 |
| 2015 | $1,882 | $237,300 | $112,900 | $124,400 |
Source: Public Records
Map
Nearby Homes