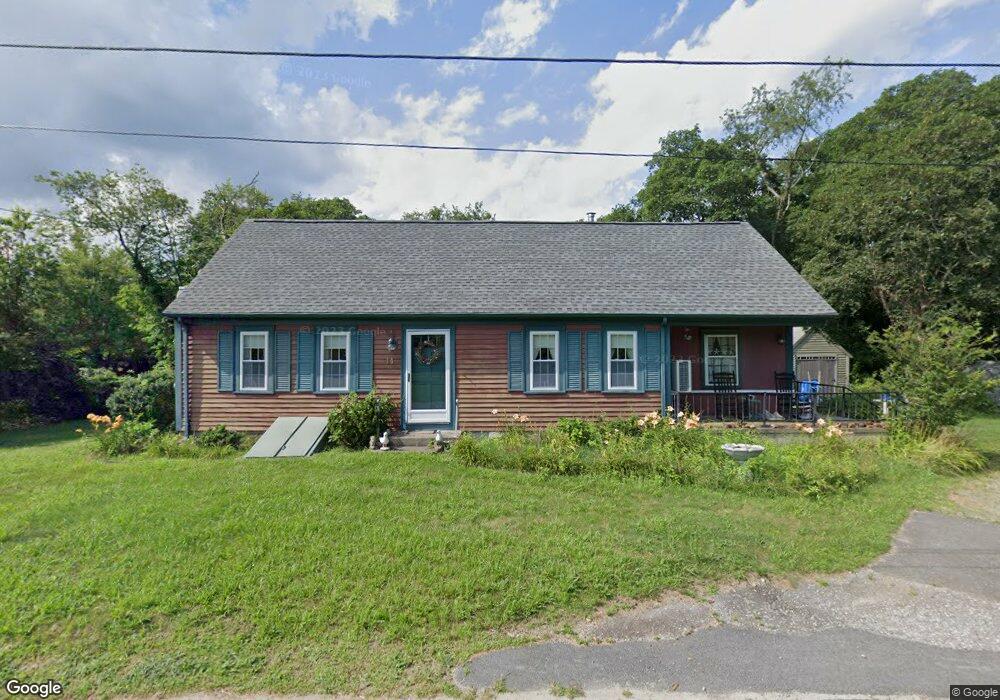
14 Brian St Westport, MA 02790
North Westport NeighborhoodEstimated Value: $463,577 - $596,000
3
Beds
2
Baths
1,790
Sq Ft
$291/Sq Ft
Est. Value
About This Home
This home is located at 14 Brian St, Westport, MA 02790 and is currently estimated at $520,894, approximately $291 per square foot. 14 Brian St is a home located in Bristol County with nearby schools including Alice A. Macomber Primary School, Westport Elementary School, and Westport Middle-High School.
Ownership History
Date
Name
Owned For
Owner Type
Purchase Details
Closed on
Apr 16, 2008
Sold by
Drury Jean E
Bought by
Drury Peter
Current Estimated Value
Home Financials for this Owner
Home Financials are based on the most recent Mortgage that was taken out on this home.
Original Mortgage
$290,000
Outstanding Balance
$184,945
Interest Rate
6.1%
Mortgage Type
Purchase Money Mortgage
Estimated Equity
$335,949
Purchase Details
Closed on
Jun 19, 2007
Sold by
Drury Jean E
Bought by
Drury Peter
Purchase Details
Closed on
Jul 2, 1997
Sold by
Dumont Claudette and Claudette Dumont M
Bought by
Drury Jean E and Drury John D
Create a Home Valuation Report for This Property
The Home Valuation Report is an in-depth analysis detailing your home's value as well as a comparison with similar homes in the area
Home Values in the Area
Average Home Value in this Area
Purchase History
| Date | Buyer | Sale Price | Title Company |
|---|---|---|---|
| Drury Peter | -- | -- | |
| Drury Peter | -- | -- | |
| Drury Jean E | $133,500 | -- |
Source: Public Records
Mortgage History
| Date | Status | Borrower | Loan Amount |
|---|---|---|---|
| Open | Drury Jean E | $290,000 | |
| Previous Owner | Drury Jean E | $21,000 |
Source: Public Records
Tax History Compared to Growth
Tax History
| Year | Tax Paid | Tax Assessment Tax Assessment Total Assessment is a certain percentage of the fair market value that is determined by local assessors to be the total taxable value of land and additions on the property. | Land | Improvement |
|---|---|---|---|---|
| 2025 | $2,367 | $317,700 | $163,600 | $154,100 |
| 2024 | $2,343 | $303,100 | $151,600 | $151,500 |
| 2023 | $2,286 | $280,100 | $137,500 | $142,600 |
| 2022 | $1,964 | $244,100 | $130,600 | $113,500 |
| 2021 | $1,964 | $227,900 | $118,800 | $109,100 |
| 2020 | $1,830 | $217,100 | $108,000 | $109,100 |
| 2019 | $1,702 | $205,800 | $108,000 | $97,800 |
| 2018 | $1,358 | $164,200 | $91,300 | $72,900 |
| 2017 | $1,368 | $171,700 | $97,500 | $74,200 |
| 2016 | $1,319 | $166,700 | $92,500 | $74,200 |
| 2015 | $1,402 | $176,800 | $106,300 | $70,500 |
Source: Public Records
Map
Nearby Homes