M
Seller's Agent in 2019
Milana Inotaev
Coldwell Banker Realty

Estimated Value: $474,000 - $526,000
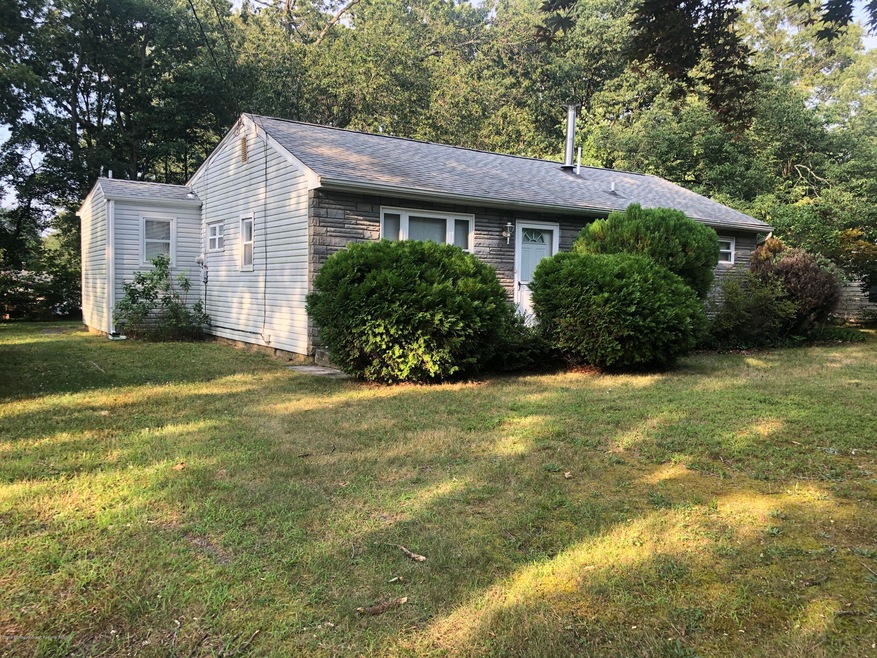
Amazing investment opportunity!!! Investors, this is your chance to purchase a beautiful property! This ranch has great potential! Buyers be aware, this house is being sold as is. Buyers will be responsible for any inspection.
Last Agent to Sell the Property
Milana Inotaev
Coldwell Banker Realty Listed on: 07/23/2019
| Date | Buyer | Sale Price | Title Company |
|---|---|---|---|
| Orzuna Angelica | $360,000 | Heritage Abstract Company | |
| Orzuna Angelica | $360,000 | Fidelity National Title | |
| Buchel Richard | $170,000 | Mid State Abstract Company |
| Date | Status | Borrower | Loan Amount |
|---|---|---|---|
| Open | Orzuna Angelica | $349,200 | |
| Previous Owner | Orzuna Angelica | $349,200 |
| Date | Event | Price | List to Sale | Price per Sq Ft |
|---|---|---|---|---|
| 08/30/2019 08/30/19 | Sold | $170,000 | -- | $216 / Sq Ft |
| Year | Tax Paid | Tax Assessment Tax Assessment Total Assessment is a certain percentage of the fair market value that is determined by local assessors to be the total taxable value of land and additions on the property. | Land | Improvement |
|---|---|---|---|---|
| 2025 | $8,438 | $491,500 | $269,000 | $222,500 |
| 2024 | $8,228 | $475,400 | $257,000 | $218,400 |
M
Seller's Agent in 2019
Milana Inotaev
Coldwell Banker Realty

Buyer's Agent in 2019
Candice Connelly
Keller Williams Realty East Monmouth
(732) 850-3609
5 Total Sales
Source: MOREMLS (Monmouth Ocean Regional REALTORS®)
MLS Number: 21930301
APN: 21-00099-0000-00009
Disclaimer: Certain information contained herein is derived from information provided by parties other than Homes.com. All information provided is deemed reliable, but is not guaranteed to be accurate and should be independently verified.
![]() IDX information is provided exclusively for personal, non-commercial use, and may not be used for any purpose other than to identify prospective properties consumers may be interested in purchasing.
IDX information is provided exclusively for personal, non-commercial use, and may not be used for any purpose other than to identify prospective properties consumers may be interested in purchasing.
Information is deemed reliable but not guaranteed.
Ask me questions while you tour the home.