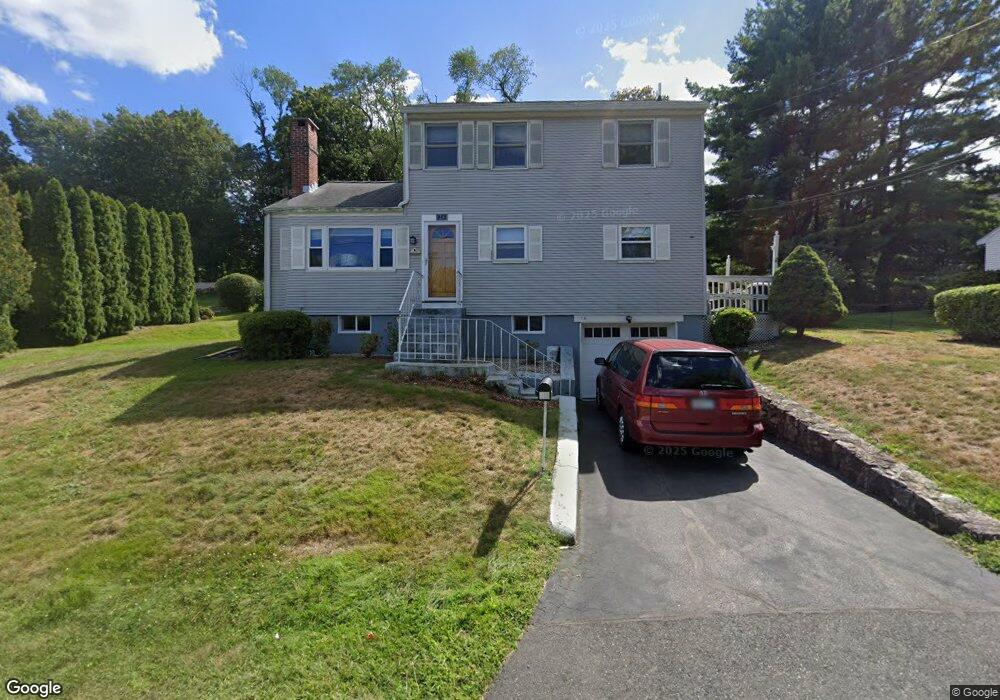
14 Bulow Rd Hingham, MA 02043
Estimated Value: $787,000 - $980,000
4
Beds
3
Baths
1,550
Sq Ft
$574/Sq Ft
Est. Value
About This Home
This home is located at 14 Bulow Rd, Hingham, MA 02043 and is currently estimated at $889,157, approximately $573 per square foot. 14 Bulow Rd is a home located in Plymouth County with nearby schools including William L. Foster Elementary School, Hingham Middle School, and Hingham High School.
Ownership History
Date
Name
Owned For
Owner Type
Purchase Details
Closed on
Nov 12, 2021
Sold by
Chen Min H and Chen Ho Y
Bought by
Chen Ft
Current Estimated Value
Purchase Details
Closed on
Apr 30, 2003
Sold by
Murphy Karyn M
Bought by
Chen Min H and Chen Ho Y
Home Financials for this Owner
Home Financials are based on the most recent Mortgage that was taken out on this home.
Original Mortgage
$281,600
Interest Rate
5.82%
Mortgage Type
Purchase Money Mortgage
Purchase Details
Closed on
Dec 15, 2000
Sold by
Wilson Gregory J and Wilson Mary P
Bought by
Murphy Karyn M
Purchase Details
Closed on
Apr 28, 1994
Sold by
Wood Robert H and Wood Kathleen C
Bought by
Wilson Gregory J and Daly Mary P
Purchase Details
Closed on
May 25, 1988
Sold by
Hines Michael J
Bought by
Wood Robert H
Create a Home Valuation Report for This Property
The Home Valuation Report is an in-depth analysis detailing your home's value as well as a comparison with similar homes in the area
Purchase History
| Date | Buyer | Sale Price | Title Company |
|---|---|---|---|
| Chen Ft | -- | None Available | |
| Chen Min H | $352,000 | -- | |
| Murphy Karyn M | $285,000 | -- | |
| Wilson Gregory J | $142,000 | -- | |
| Wood Robert H | $153,000 | -- |
Source: Public Records
Mortgage History
| Date | Status | Borrower | Loan Amount |
|---|---|---|---|
| Previous Owner | Wood Robert H | $286,000 | |
| Previous Owner | Wood Robert H | $281,600 |
Source: Public Records
Tax History
| Year | Tax Paid | Tax Assessment Tax Assessment Total Assessment is a certain percentage of the fair market value that is determined by local assessors to be the total taxable value of land and additions on the property. | Land | Improvement |
|---|---|---|---|---|
| 2025 | $8,137 | $761,200 | $395,300 | $365,900 |
| 2024 | $8,177 | $753,600 | $395,300 | $358,300 |
| 2023 | $7,224 | $722,400 | $395,300 | $327,100 |
| 2022 | $6,994 | $605,000 | $341,000 | $264,000 |
| 2021 | $6,879 | $583,000 | $341,000 | $242,000 |
| 2020 | $6,137 | $532,300 | $341,000 | $191,300 |
| 2019 | $6,149 | $520,700 | $341,000 | $179,700 |
| 2018 | $19,347 | $489,800 | $263,500 | $226,300 |
| 2017 | $5,568 | $454,500 | $264,200 | $190,300 |
| 2016 | $5,519 | $441,900 | $251,600 | $190,300 |
| 2015 | $5,174 | $412,900 | $222,600 | $190,300 |
Source: Public Records
Map
Nearby Homes
- 43 Park View Dr
- 2 Langlee Rd
- 1 Squirrel Hill Ln
- 151 Stayner Dr Unit 151
- 160 Hms Stayner Dr
- 160 Hms Stayner Dr Unit 160
- 132 Hms Stayner Dr Unit 132
- 6 Adams Ct
- 37 Foley Beach Rd
- 225 South St Unit 1
- 12 Daley Rd
- 23 Shipyard Dr Unit 206
- 191 South St
- 190 South St Unit B
- 28 Marsh St
- 13 Beals Cove Rd Unit K
- 1206 Tuckers Ln Unit 1206
- 16 Foley Beach Rd
- 10 Shipyard Dr Unit 313
- 21 Hersey St
Your Personal Tour Guide
Ask me questions while you tour the home.