14 Canterbury Square Unit 301 Alexandria, VA 22304
Landmark NeighborhoodEstimated Value: $245,402 - $277,000
2
Beds
1
Bath
970
Sq Ft
$266/Sq Ft
Est. Value
About This Home
This home is located at 14 Canterbury Square Unit 301, Alexandria, VA 22304 and is currently estimated at $258,467, approximately $266 per square foot. 14 Canterbury Square Unit 301 is a home located in Alexandria City with nearby schools including Patrick Henry Elementary School, Alexandria City High School, and Queen of Apostles Catholic School.
Ownership History
Date
Name
Owned For
Owner Type
Purchase Details
Closed on
Nov 1, 2009
Sold by
Federal National Mortgage Association
Bought by
Bahta David
Current Estimated Value
Home Financials for this Owner
Home Financials are based on the most recent Mortgage that was taken out on this home.
Original Mortgage
$117,826
Outstanding Balance
$76,383
Interest Rate
4.86%
Mortgage Type
FHA
Estimated Equity
$182,084
Purchase Details
Closed on
May 22, 2009
Sold by
Profesnl 4Closure Corp Su
Bought by
Federal National Mortgage Association
Purchase Details
Closed on
Feb 2, 1998
Sold by
Throckmorton David M
Bought by
Lim Choi D
Home Financials for this Owner
Home Financials are based on the most recent Mortgage that was taken out on this home.
Original Mortgage
$69,800
Interest Rate
7.02%
Mortgage Type
New Conventional
Create a Home Valuation Report for This Property
The Home Valuation Report is an in-depth analysis detailing your home's value as well as a comparison with similar homes in the area
Home Values in the Area
Average Home Value in this Area
Purchase History
| Date | Buyer | Sale Price | Title Company |
|---|---|---|---|
| Bahta David | $120,000 | -- | |
| Federal National Mortgage Association | $224,900 | -- | |
| Lim Choi D | $72,000 | Island Title Corp |
Source: Public Records
Mortgage History
| Date | Status | Borrower | Loan Amount |
|---|---|---|---|
| Open | Bahta David | $117,826 | |
| Previous Owner | Lim Choi D | $69,800 |
Source: Public Records
Tax History Compared to Growth
Tax History
| Year | Tax Paid | Tax Assessment Tax Assessment Total Assessment is a certain percentage of the fair market value that is determined by local assessors to be the total taxable value of land and additions on the property. | Land | Improvement |
|---|---|---|---|---|
| 2025 | $2,795 | $244,439 | $103,342 | $141,097 |
| 2024 | $2,795 | $238,477 | $100,821 | $137,656 |
| 2023 | $2,520 | $226,989 | $95,963 | $131,026 |
| 2022 | $2,470 | $222,538 | $94,081 | $128,457 |
| 2021 | $2,470 | $222,538 | $94,081 | $128,457 |
| 2020 | $2,315 | $211,941 | $89,601 | $122,340 |
| 2019 | $2,158 | $190,938 | $80,722 | $110,216 |
| 2018 | $2,075 | $183,594 | $77,617 | $105,977 |
| 2017 | $2,075 | $183,594 | $77,617 | $105,977 |
| 2016 | $1,970 | $183,594 | $77,617 | $105,977 |
| 2015 | $1,877 | $179,994 | $76,095 | $103,899 |
| 2014 | $1,731 | $166,009 | $70,459 | $95,550 |
Source: Public Records
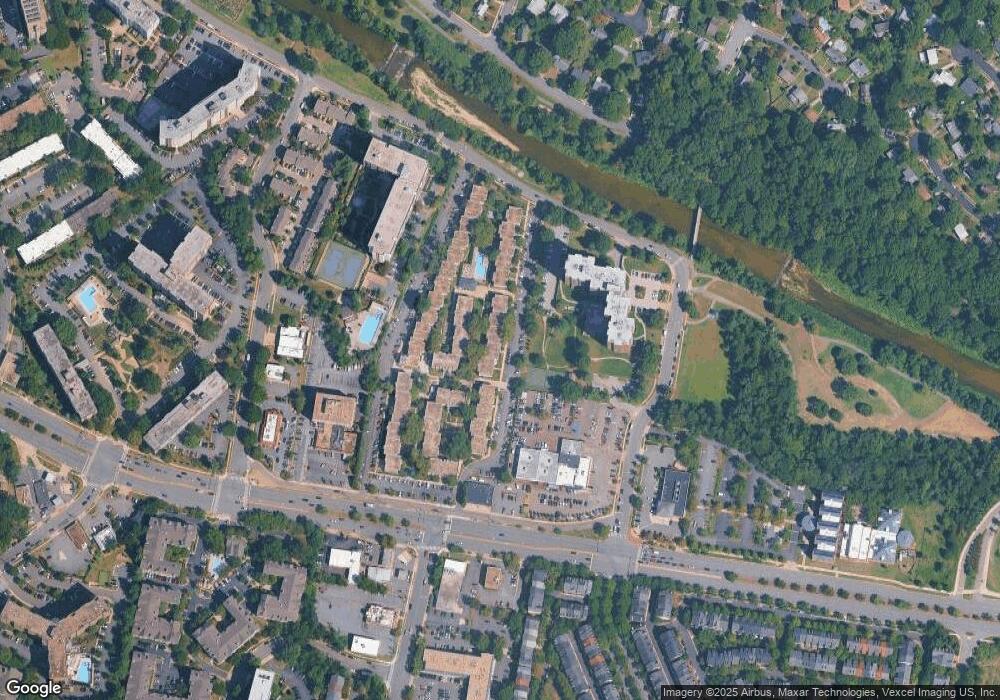
Map
Nearby Homes
- 27 Canterbury Square Unit 201
- 200 N Pickett St Unit 703
- 200 N Pickett St Unit 215
- 200 N Pickett St Unit 1513
- 200 N Pickett St Unit 1515
- 200 N Pickett St Unit 311
- 200 N Pickett St Unit 108
- 5300 Holmes Run Pkwy Unit 402
- 5300 Holmes Run Pkwy Unit 1210
- 5300 Holmes Run Pkwy Unit 709
- 5300 Holmes Run Pkwy Unit 506
- 1 Canterbury Square Unit 101
- 119 Martin Ln
- 5101 Gardner Dr
- 5340 Holmes Run Pkwy Unit 217
- 5340 Holmes Run Pkwy Unit 700
- 5340 Holmes Run Pkwy Unit 804
- 5340 Holmes Run Pkwy Unit 1119
- 5340 Holmes Run Pkwy Unit 400
- 5340 Holmes Run Pkwy Unit 101
- 14 Canterbury Square
- 14 Canterbury Square Unit 202
- 14 Canterbury Square Unit 302
- 14 Canterbury Square Unit 102
- 14 Canterbury Square Unit 101
- 14 Canterbury Square Unit 201
- 16 Canterbury Square Unit 302
- 16 Canterbury Square Unit 202
- 16 Canterbury Square Unit 301
- 16 Canterbury Square Unit 101
- 16 Canterbury Square Unit 201
- 12 Canterbury Square Unit 101
- 12 Canterbury Square Unit 102
- 12 Canterbury Square Unit 201
- 12 Canterbury Square Unit 202
- 12 Canterbury Square Unit 302
- 12 Canterbury Square Unit 301
- 18 Canterbury Square Unit Canterbury
- 18 Canterbury Square Unit 102
- 18 Canterbury Square Unit 101