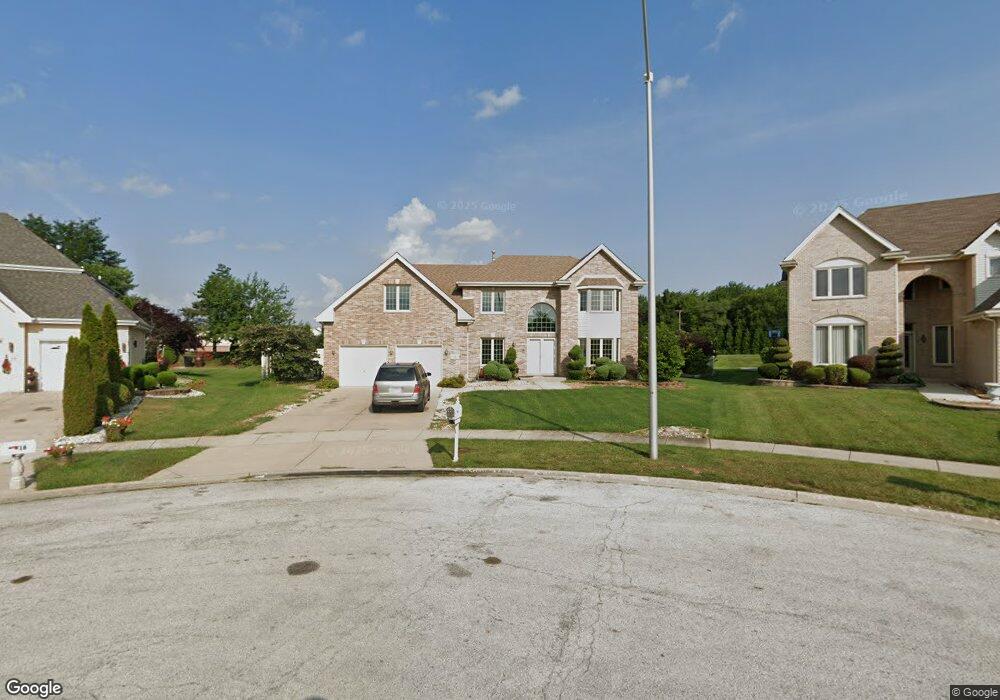
14 Carrington Ct Hazel Crest, IL 60429
Village West NeighborhoodEstimated Value: $347,000 - $534,000
4
Beds
3
Baths
2,254
Sq Ft
$187/Sq Ft
Est. Value
About This Home
This home is located at 14 Carrington Ct, Hazel Crest, IL 60429 and is currently estimated at $420,796, approximately $186 per square foot. 14 Carrington Ct is a home located in Cook County with nearby schools including Flossmoor Hills Elementary School, Parker Junior High School, and Homewood-Flossmoor High School.
Ownership History
Date
Name
Owned For
Owner Type
Purchase Details
Closed on
Jun 23, 2022
Sold by
Ingram Brian
Bought by
Ingram Brian
Current Estimated Value
Home Financials for this Owner
Home Financials are based on the most recent Mortgage that was taken out on this home.
Original Mortgage
$290,000
Outstanding Balance
$275,311
Interest Rate
5.49%
Mortgage Type
New Conventional
Estimated Equity
$145,485
Purchase Details
Closed on
May 29, 2018
Sold by
Ingram Brian
Bought by
People Of The States Of Illinois Departm
Purchase Details
Closed on
Feb 28, 2014
Sold by
Willis Ladeishia and Ingram Brian
Bought by
Ingram Brian
Create a Home Valuation Report for This Property
The Home Valuation Report is an in-depth analysis detailing your home's value as well as a comparison with similar homes in the area
Home Values in the Area
Average Home Value in this Area
Purchase History
| Date | Buyer | Sale Price | Title Company |
|---|---|---|---|
| Ingram Brian | -- | None Listed On Document | |
| People Of The States Of Illinois Departm | $900 | None Available | |
| Ingram Brian | -- | None Available |
Source: Public Records
Mortgage History
| Date | Status | Borrower | Loan Amount |
|---|---|---|---|
| Open | Ingram Brian | $290,000 |
Source: Public Records
Tax History
| Year | Tax Paid | Tax Assessment Tax Assessment Total Assessment is a certain percentage of the fair market value that is determined by local assessors to be the total taxable value of land and additions on the property. | Land | Improvement |
|---|---|---|---|---|
| 2025 | $17,241 | $34,686 | $12,709 | $21,977 |
| 2024 | $17,241 | $34,686 | $12,709 | $21,977 |
| 2023 | $14,831 | $36,000 | $12,709 | $23,291 |
| 2022 | $14,831 | $23,865 | $11,184 | $12,681 |
| 2021 | $14,717 | $23,865 | $11,184 | $12,681 |
| 2020 | $13,919 | $23,865 | $11,184 | $12,681 |
| 2019 | $14,309 | $24,038 | $10,167 | $13,871 |
| 2018 | $12,910 | $22,773 | $8,902 | $13,871 |
| 2017 | $12,310 | $22,773 | $8,902 | $13,871 |
| 2016 | $12,132 | $22,225 | $8,012 | $14,213 |
| 2015 | $11,880 | $22,225 | $8,012 | $14,213 |
| 2014 | $11,527 | $22,225 | $8,012 | $14,213 |
| 2013 | $11,899 | $25,247 | $8,012 | $17,235 |
Source: Public Records
Map
Nearby Homes
- 173 Williamsburg Rd Unit 1
- 1101 Williamsburg Rd Unit 1
- 1115 Williamsburg Rd Unit 1
- 1135 Williamsburg Rd Unit 1
- 18040 Springfield Ave
- 2295 Windsor Ln
- 4445 Provincetown Dr
- 2323 Windsor Ln
- 2271 Windsor Ln Unit 2
- 4521 Provincetown Dr
- 18037 Edwards Ave
- 18010 Olympia Dr
- 3800 River Rd
- 17975 Amherst Ct Unit 301
- 3710 Briar Ln
- 18207 Ravisloe Terrace
- 17975 Huntleigh Ct Unit 301
- 17963 Amherst Ct Unit 102
- 18018 Chantilly Ln Unit S3
- 17963 Huntleigh Ct Unit 302
- 12 Carrington Ct
- 16 Carrington Ct
- 10 Carrington Ct
- 18 Carrington Ct
- 8 Carrington Ct
- 18254 Springfield Ave
- 20 Carrington Ct
- 6 Carrington Ct
- 3944 183rd St
- 5 Carrington Ct
- 18251 Springfield Ave
- 7 Carrington Ct
- 3 Carrington Ct
- 22 Carrington Ct
- 9 Carrington Ct
- 18248 Springfield Ave
- 24 Carrington Ct
- 4 Carrington Ct
- 26 Carrington Ct
- 1 Carrington Ct
Your Personal Tour Guide
Ask me questions while you tour the home.