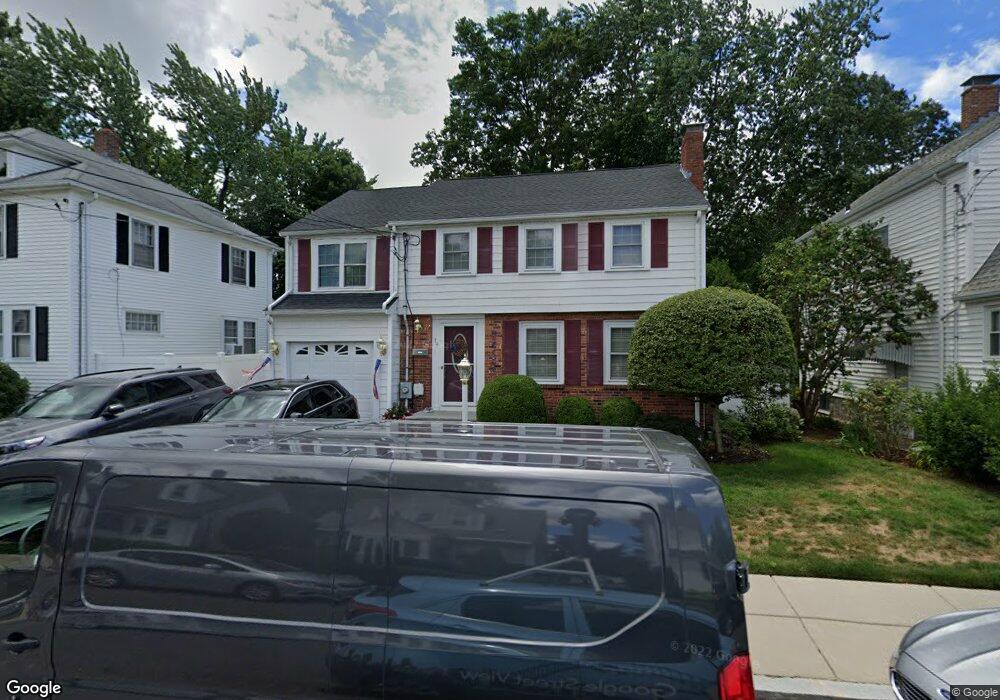
14 Carroll St West Roxbury, MA 02132
West Roxbury NeighborhoodEstimated Value: $714,000 - $916,000
4
Beds
2
Baths
1,825
Sq Ft
$459/Sq Ft
Est. Value
About This Home
This home is located at 14 Carroll St, West Roxbury, MA 02132 and is currently estimated at $837,749, approximately $459 per square foot. 14 Carroll St is a home located in Suffolk County with nearby schools including St Theresa School, Catholic Memorial School, and The Roxbury Latin School.
Ownership History
Date
Name
Owned For
Owner Type
Purchase Details
Closed on
Feb 23, 2011
Sold by
Freeman Joseph
Bought by
Freeman Joseph and Freeman Patricia
Current Estimated Value
Home Financials for this Owner
Home Financials are based on the most recent Mortgage that was taken out on this home.
Original Mortgage
$159,600
Outstanding Balance
$6,134
Interest Rate
4.75%
Mortgage Type
Purchase Money Mortgage
Estimated Equity
$831,615
Purchase Details
Closed on
Sep 10, 1993
Sold by
Lavin Richard R
Bought by
Freeman Joseph
Create a Home Valuation Report for This Property
The Home Valuation Report is an in-depth analysis detailing your home's value as well as a comparison with similar homes in the area
Home Values in the Area
Average Home Value in this Area
Purchase History
| Date | Buyer | Sale Price | Title Company |
|---|---|---|---|
| Freeman Joseph | -- | -- | |
| Freeman Joseph | $167,500 | -- |
Source: Public Records
Mortgage History
| Date | Status | Borrower | Loan Amount |
|---|---|---|---|
| Open | Freeman Joseph | $159,600 | |
| Previous Owner | Freeman Joseph | $173,000 | |
| Previous Owner | Freeman Joseph | $35,000 | |
| Previous Owner | Freeman Joseph | $155,000 |
Source: Public Records
Tax History Compared to Growth
Tax History
| Year | Tax Paid | Tax Assessment Tax Assessment Total Assessment is a certain percentage of the fair market value that is determined by local assessors to be the total taxable value of land and additions on the property. | Land | Improvement |
|---|---|---|---|---|
| 2025 | $8,776 | $757,900 | $195,300 | $562,600 |
| 2024 | $7,637 | $700,600 | $199,400 | $501,200 |
| 2023 | $7,168 | $667,400 | $190,000 | $477,400 |
| 2022 | $6,601 | $606,700 | $172,700 | $434,000 |
| 2021 | $6,172 | $578,400 | $169,300 | $409,100 |
| 2020 | $5,904 | $559,100 | $153,300 | $405,800 |
| 2019 | $5,611 | $532,400 | $128,600 | $403,800 |
| 2018 | $5,167 | $493,000 | $128,600 | $364,400 |
| 2017 | $5,116 | $483,100 | $128,600 | $354,500 |
| 2016 | $5,159 | $469,000 | $128,600 | $340,400 |
| 2015 | $5,420 | $447,600 | $150,400 | $297,200 |
| 2014 | $5,313 | $422,300 | $150,400 | $271,900 |
Source: Public Records
Map
Nearby Homes
- 9 Carroll St
- 331 Vermont St
- 100 Keith St
- 15 Atlantis St
- 480 Baker St
- 615 Lagrange St
- 101 Chesbrough Rd
- 381 Baker St
- 577 Baker St Unit 577
- 857 Vfw Pkwy
- 583 Baker St Unit 583
- 183 Temple St
- 5 Crest St
- 539 Lagrange St
- 79 Potomac St
- 349 Baker St Unit A
- 72 Lyall St
- 579 Baker St Unit 579
- 865 Lagrange St Unit 5
- 97 Anderer Ln Unit 105