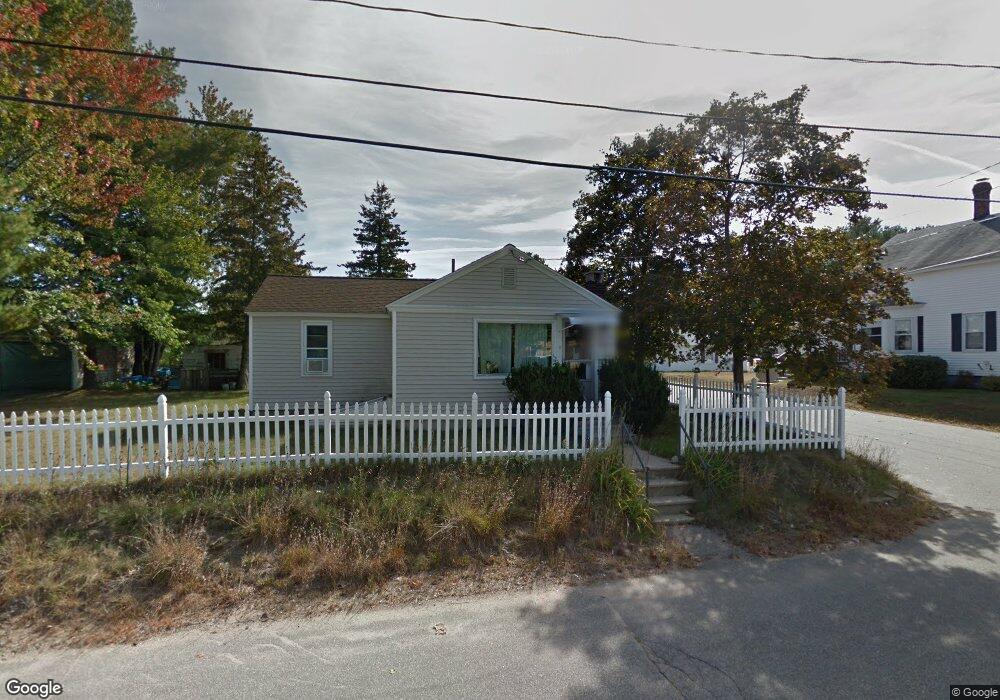
14 Carver St Sanford, ME 04073
Estimated Value: $253,000 - $313,000
2
Beds
1
Bath
830
Sq Ft
$341/Sq Ft
Est. Value
About This Home
This home is located at 14 Carver St, Sanford, ME 04073 and is currently estimated at $283,153, approximately $341 per square foot. 14 Carver St is a home located in York County with nearby schools including Sanford Christian Academy and St Thomas Consolidated School.
Ownership History
Date
Name
Owned For
Owner Type
Purchase Details
Closed on
Aug 31, 2009
Sold by
Roussell Robert E
Bought by
Violette Brandon R
Current Estimated Value
Home Financials for this Owner
Home Financials are based on the most recent Mortgage that was taken out on this home.
Original Mortgage
$112,785
Outstanding Balance
$73,085
Interest Rate
5.17%
Mortgage Type
FHA
Estimated Equity
$210,068
Create a Home Valuation Report for This Property
The Home Valuation Report is an in-depth analysis detailing your home's value as well as a comparison with similar homes in the area
Home Values in the Area
Average Home Value in this Area
Purchase History
| Date | Buyer | Sale Price | Title Company |
|---|---|---|---|
| Violette Brandon R | -- | -- |
Source: Public Records
Mortgage History
| Date | Status | Borrower | Loan Amount |
|---|---|---|---|
| Open | Violette Brandon R | $112,785 | |
| Previous Owner | Violette Brandon R | $138,550 |
Source: Public Records
Tax History Compared to Growth
Tax History
| Year | Tax Paid | Tax Assessment Tax Assessment Total Assessment is a certain percentage of the fair market value that is determined by local assessors to be the total taxable value of land and additions on the property. | Land | Improvement |
|---|---|---|---|---|
| 2025 | $2,866 | $167,600 | $34,100 | $133,500 |
| 2024 | $2,705 | $167,600 | $34,100 | $133,500 |
| 2023 | $2,516 | $166,200 | $34,100 | $132,100 |
| 2022 | $2,460 | $166,200 | $34,100 | $132,100 |
| 2021 | $2,431 | $133,700 | $34,100 | $99,600 |
| 2020 | $2,383 | $118,200 | $34,100 | $84,100 |
| 2019 | $2,296 | $110,900 | $34,100 | $76,800 |
| 2018 | $2,251 | $109,800 | $34,100 | $75,700 |
| 2017 | $2,174 | $104,800 | $34,100 | $70,700 |
| 2016 | $2,213 | $97,300 | $34,100 | $63,200 |
| 2015 | $2,125 | $96,400 | $34,100 | $62,300 |
| 2014 | $2,084 | $96,400 | $34,100 | $62,300 |
| 2013 | -- | $96,400 | $34,100 | $62,300 |
Source: Public Records
Map
Nearby Homes