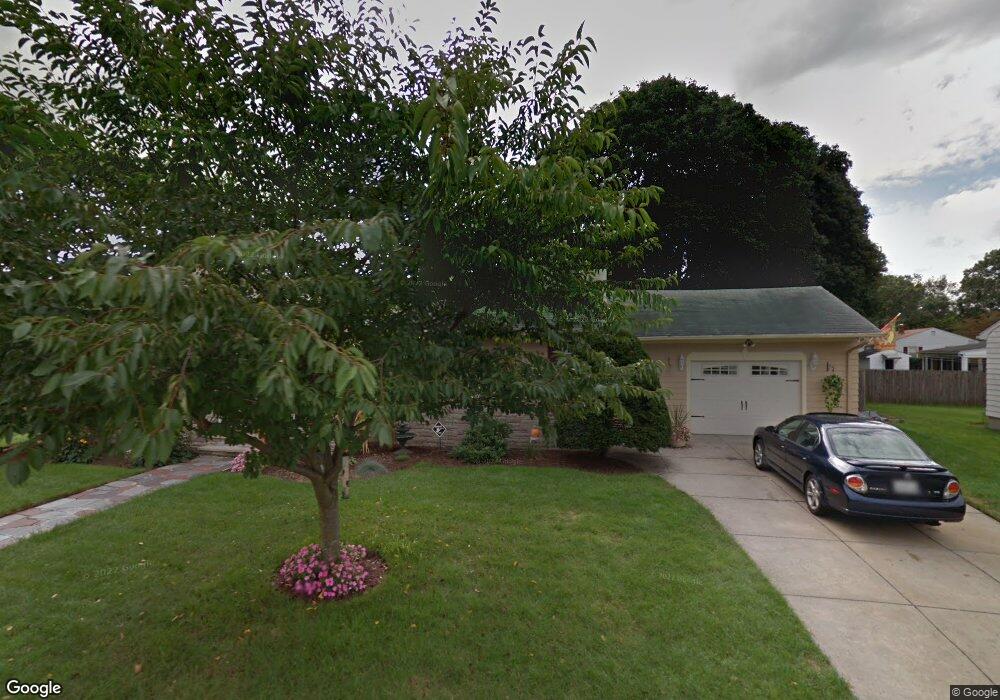
14 Chandler St North Providence, RI 02911
Allendale-Lymansville NeighborhoodEstimated Value: $432,397 - $519,000
3
Beds
1
Bath
1,326
Sq Ft
$346/Sq Ft
Est. Value
About This Home
This home is located at 14 Chandler St, North Providence, RI 02911 and is currently estimated at $459,349, approximately $346 per square foot. 14 Chandler St is a home located in Providence County with nearby schools including North Providence High School, St. Thomas Regional School, and St. Augustine School.
Ownership History
Date
Name
Owned For
Owner Type
Purchase Details
Closed on
Jan 5, 1999
Sold by
Cascione John F
Bought by
Andreozzi Steven M and Andreozzi Joanne
Current Estimated Value
Home Financials for this Owner
Home Financials are based on the most recent Mortgage that was taken out on this home.
Original Mortgage
$113,050
Outstanding Balance
$26,402
Interest Rate
6.84%
Estimated Equity
$432,947
Purchase Details
Closed on
Mar 31, 1994
Sold by
Cardello Joseph E and Cardello Elaine
Bought by
Cascione John F
Home Financials for this Owner
Home Financials are based on the most recent Mortgage that was taken out on this home.
Original Mortgage
$107,100
Interest Rate
7.07%
Create a Home Valuation Report for This Property
The Home Valuation Report is an in-depth analysis detailing your home's value as well as a comparison with similar homes in the area
Home Values in the Area
Average Home Value in this Area
Purchase History
| Date | Buyer | Sale Price | Title Company |
|---|---|---|---|
| Andreozzi Steven M | $119,000 | -- | |
| Cascione John F | $119,000 | -- | |
| Andreozzi Steven M | $119,000 | -- | |
| Cascione John F | $119,000 | -- |
Source: Public Records
Mortgage History
| Date | Status | Borrower | Loan Amount |
|---|---|---|---|
| Open | Cascione John F | $40,000 | |
| Open | Cascione John F | $113,050 | |
| Closed | Cascione John F | $113,050 | |
| Previous Owner | Cascione John F | $107,100 |
Source: Public Records
Tax History Compared to Growth
Tax History
| Year | Tax Paid | Tax Assessment Tax Assessment Total Assessment is a certain percentage of the fair market value that is determined by local assessors to be the total taxable value of land and additions on the property. | Land | Improvement |
|---|---|---|---|---|
| 2024 | $5,481 | $330,000 | $89,400 | $240,600 |
| 2023 | $5,481 | $330,000 | $89,400 | $240,600 |
| 2022 | $5,338 | $234,000 | $68,500 | $165,500 |
| 2021 | $5,338 | $234,000 | $68,500 | $165,500 |
| 2020 | $5,338 | $234,000 | $68,500 | $165,500 |
| 2017 | $4,859 | $185,900 | $47,600 | $138,300 |
| 2016 | $4,389 | $157,100 | $47,900 | $109,200 |
| 2015 | $4,389 | $157,100 | $47,900 | $109,200 |
| 2014 | $3,512 | $157,100 | $47,900 | $109,200 |
Source: Public Records
Map
Nearby Homes
- 4 Hatherly St
- 494 Woonasquatucket Ave Unit 107
- 494 Woonasquatucket Ave Unit 407
- 494 Woonasquatucket Ave Unit 208
- 91 East Ave
- 2 Simpson St
- 1875 Smith St
- 22 Whipple Ave
- 36 Ferncliff Ave
- 30 Intervale Ave
- 96 Merchant St
- 19 Warren Ave Unit 3
- 2 Oak Grove Blvd
- 32 Orchard St
- 15 Redfern St
- 95 Angell Ave
- 22 Grove Ave
- 16 Grover St
- 10 Sadler St
- 315 George Waterman Rd