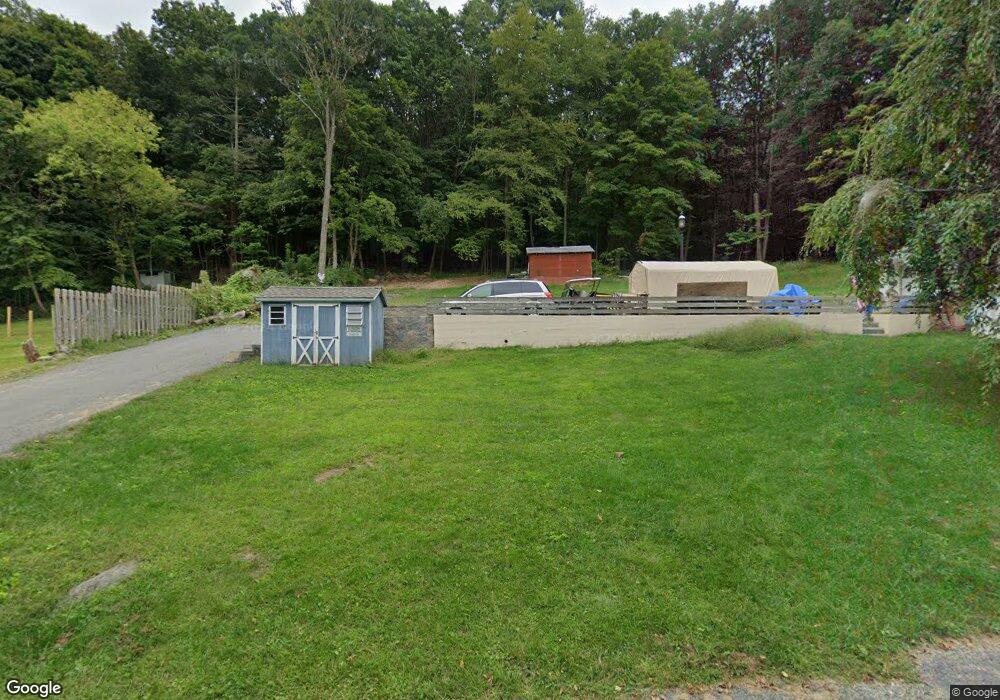
14 Chestnut St Oxford, NJ 07863
Estimated Value: $227,090 - $267,000
--
Bed
--
Bath
958
Sq Ft
$255/Sq Ft
Est. Value
About This Home
This home is located at 14 Chestnut St, Oxford, NJ 07863 and is currently estimated at $244,023, approximately $254 per square foot. 14 Chestnut St is a home located in Warren County with nearby schools including Oxford Central School.
Ownership History
Date
Name
Owned For
Owner Type
Purchase Details
Closed on
Jun 2, 2014
Sold by
Musick John
Bought by
Brien Michael O
Current Estimated Value
Home Financials for this Owner
Home Financials are based on the most recent Mortgage that was taken out on this home.
Original Mortgage
$32,000
Outstanding Balance
$25,154
Interest Rate
5.12%
Mortgage Type
FHA
Estimated Equity
$218,869
Purchase Details
Closed on
Sep 14, 1995
Sold by
Musick Eva Marie
Bought by
Musick Eva Marie
Create a Home Valuation Report for This Property
The Home Valuation Report is an in-depth analysis detailing your home's value as well as a comparison with similar homes in the area
Home Values in the Area
Average Home Value in this Area
Purchase History
| Date | Buyer | Sale Price | Title Company |
|---|---|---|---|
| Brien Michael O | -- | Associated Title | |
| Brien Michael O | $42,000 | Associated Title | |
| Musick Eva Marie | -- | -- |
Source: Public Records
Mortgage History
| Date | Status | Borrower | Loan Amount |
|---|---|---|---|
| Open | Brien Michael O | $32,000 | |
| Closed | Brien Michael O | $32,000 |
Source: Public Records
Tax History Compared to Growth
Tax History
| Year | Tax Paid | Tax Assessment Tax Assessment Total Assessment is a certain percentage of the fair market value that is determined by local assessors to be the total taxable value of land and additions on the property. | Land | Improvement |
|---|---|---|---|---|
| 2025 | $4,580 | $94,500 | $37,100 | $57,400 |
| 2024 | $4,218 | $94,500 | $37,100 | $57,400 |
| 2023 | $4,146 | $94,500 | $37,100 | $57,400 |
| 2022 | $4,146 | $94,500 | $37,100 | $57,400 |
| 2021 | $4,030 | $94,500 | $37,100 | $57,400 |
| 2020 | $3,943 | $94,500 | $37,100 | $57,400 |
| 2019 | $3,795 | $94,500 | $37,100 | $57,400 |
| 2018 | $3,795 | $94,500 | $37,100 | $57,400 |
| 2017 | $3,711 | $94,500 | $37,100 | $57,400 |
| 2016 | $3,733 | $94,500 | $37,100 | $57,400 |
| 2015 | $3,257 | $104,900 | $65,700 | $39,200 |
| 2014 | $2,554 | $104,900 | $65,700 | $39,200 |
Source: Public Records
Map
Nearby Homes