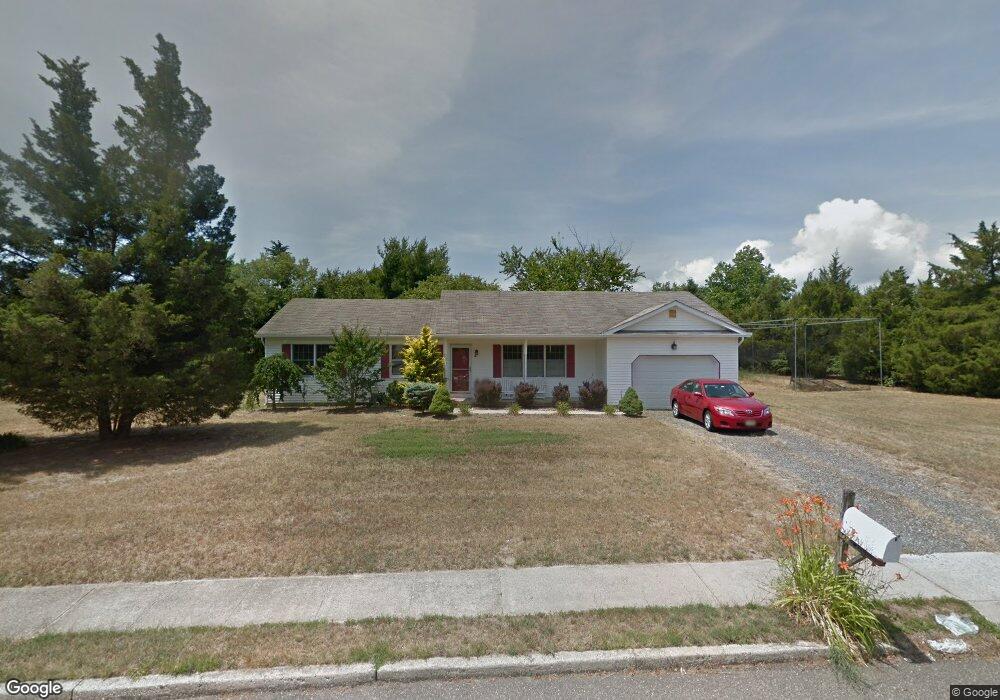
14 Cindy Ln Marmora, NJ 08223
Estimated Value: $446,408 - $531,000
3
Beds
2
Baths
1,572
Sq Ft
$310/Sq Ft
Est. Value
About This Home
This home is located at 14 Cindy Ln, Marmora, NJ 08223 and is currently estimated at $487,602, approximately $310 per square foot. 14 Cindy Ln is a home located in Cape May County with nearby schools including Upper Township Primary School, Upper Township Elementary School, and Upper Township Middle School.
Ownership History
Date
Name
Owned For
Owner Type
Purchase Details
Closed on
May 30, 2021
Sold by
Millevoi Kenneth J and Dodson Heather M
Bought by
Millevoi Kenneth J
Current Estimated Value
Home Financials for this Owner
Home Financials are based on the most recent Mortgage that was taken out on this home.
Original Mortgage
$191,000
Interest Rate
2.9%
Mortgage Type
Stand Alone Refi Refinance Of Original Loan
Purchase Details
Closed on
Jul 28, 2017
Sold by
Garrison Sharon L
Bought by
Millevoi Kenneth J and Dodson Heather M
Purchase Details
Closed on
Oct 5, 1998
Sold by
Dingler Helen
Bought by
Garrison Sharon
Home Financials for this Owner
Home Financials are based on the most recent Mortgage that was taken out on this home.
Original Mortgage
$125,154
Interest Rate
6.89%
Mortgage Type
FHA
Create a Home Valuation Report for This Property
The Home Valuation Report is an in-depth analysis detailing your home's value as well as a comparison with similar homes in the area
Home Values in the Area
Average Home Value in this Area
Purchase History
| Date | Buyer | Sale Price | Title Company |
|---|---|---|---|
| Millevoi Kenneth J | -- | Misc Company | |
| Millevoi Kenneth J | -- | None Listed On Document | |
| Millevoi Kenneth J | $244,000 | Freedom Title & Abstract | |
| Garrison Sharon | $9,013,600 | -- |
Source: Public Records
Mortgage History
| Date | Status | Borrower | Loan Amount |
|---|---|---|---|
| Previous Owner | Millevoi Kenneth J | $191,000 | |
| Previous Owner | Garrison Sharon | $125,154 |
Source: Public Records
Tax History
| Year | Tax Paid | Tax Assessment Tax Assessment Total Assessment is a certain percentage of the fair market value that is determined by local assessors to be the total taxable value of land and additions on the property. | Land | Improvement |
|---|---|---|---|---|
| 2025 | $5,455 | $237,700 | $124,700 | $113,000 |
| 2024 | $5,455 | $237,700 | $124,700 | $113,000 |
Source: Public Records
Map
Nearby Homes
- 731 Oceancrest Ave
- 11 Evio John Ct
- 24 E Timber Dr
- 19 Bayview Ave
- 4 Bayview Ave
- 516 N Route 9 Unit B-16
- 516 N Route 9 Unit L-2
- 430 S Shore Rd
- 734 Stagecoach Rd
- 46 Victoria Ln
- 246 Egret Ln
- 5 Klains Ln
- 124 Butter Rd
- 40 Butter Rd
- 297 Butter Rd
- 22 Red Clover Dr
- 1 Roosevelt Blvd
- 14 Lyndhurst Rd
- 344 Essex Ave
- 209 Bark Dr
Your Personal Tour Guide
Ask me questions while you tour the home.