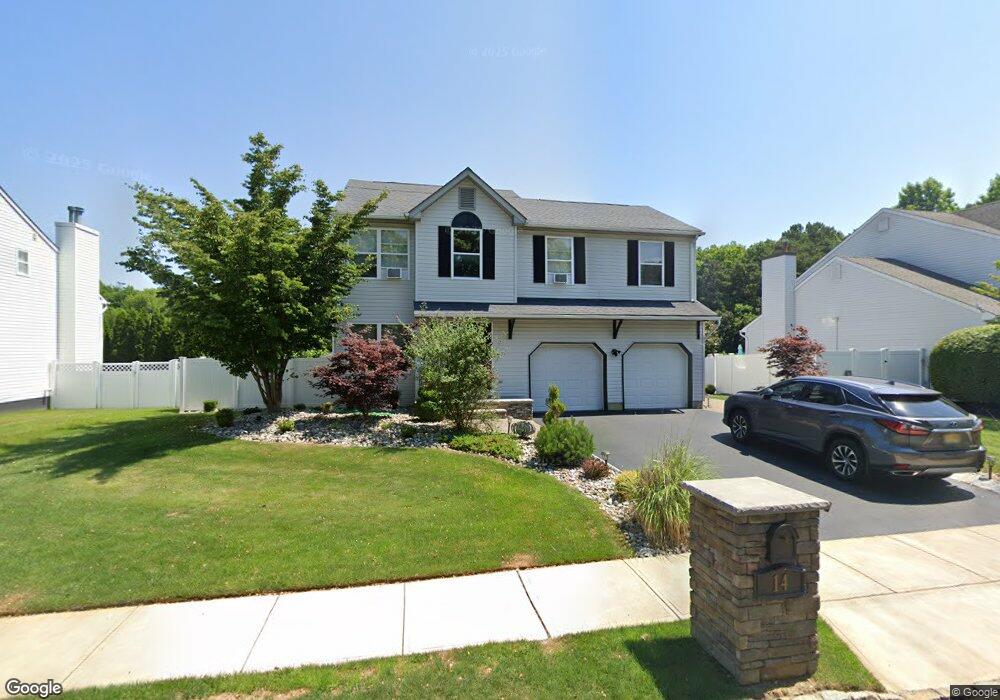
14 Claire Ct Old Bridge, NJ 08857
Estimated Value: $607,171 - $814,000
--
Bed
--
Bath
1,951
Sq Ft
$364/Sq Ft
Est. Value
About This Home
This home is located at 14 Claire Ct, Old Bridge, NJ 08857 and is currently estimated at $711,043, approximately $364 per square foot. 14 Claire Ct is a home located in Middlesex County with nearby schools including Old Bridge High School, St. Thomas the Apostle School, and Immaculate Conception School.
Ownership History
Date
Name
Owned For
Owner Type
Purchase Details
Closed on
Jan 29, 2004
Sold by
Napoli Joseph M
Bought by
Harris Robin M
Current Estimated Value
Home Financials for this Owner
Home Financials are based on the most recent Mortgage that was taken out on this home.
Original Mortgage
$312,000
Interest Rate
5.67%
Purchase Details
Closed on
Jun 14, 1995
Sold by
Lowell Manor Inc
Bought by
Napoli Joseph and Napoli Laura
Home Financials for this Owner
Home Financials are based on the most recent Mortgage that was taken out on this home.
Original Mortgage
$140,000
Interest Rate
7.82%
Create a Home Valuation Report for This Property
The Home Valuation Report is an in-depth analysis detailing your home's value as well as a comparison with similar homes in the area
Home Values in the Area
Average Home Value in this Area
Purchase History
| Date | Buyer | Sale Price | Title Company |
|---|---|---|---|
| Harris Robin M | $390,000 | -- | |
| Napoli Joseph | $194,900 | -- |
Source: Public Records
Mortgage History
| Date | Status | Borrower | Loan Amount |
|---|---|---|---|
| Previous Owner | Harris Robin M | $312,000 | |
| Previous Owner | Napoli Joseph | $140,000 |
Source: Public Records
Tax History Compared to Growth
Tax History
| Year | Tax Paid | Tax Assessment Tax Assessment Total Assessment is a certain percentage of the fair market value that is determined by local assessors to be the total taxable value of land and additions on the property. | Land | Improvement |
|---|---|---|---|---|
| 2025 | $10,413 | $184,400 | $56,500 | $127,900 |
| 2024 | $9,989 | $184,400 | $56,500 | $127,900 |
| 2023 | $9,989 | $184,400 | $56,500 | $127,900 |
| 2022 | $9,623 | $181,800 | $56,500 | $125,300 |
| 2021 | $7,062 | $181,800 | $56,500 | $125,300 |
| 2020 | $9,339 | $181,800 | $56,500 | $125,300 |
| 2019 | $9,181 | $181,800 | $56,500 | $125,300 |
| 2018 | $9,079 | $181,800 | $56,500 | $125,300 |
| 2017 | $8,785 | $181,800 | $56,500 | $125,300 |
| 2016 | $8,555 | $180,800 | $56,500 | $124,300 |
| 2015 | $8,407 | $180,800 | $56,500 | $124,300 |
| 2014 | $8,322 | $180,800 | $56,500 | $124,300 |
Source: Public Records
Map
Nearby Homes
- 14 Brookside Ave
- 37 Shirley Blvd
- 44 Shirley Blvd
- 306 Austin Ave
- 1210 Englishtown Rd
- 65 Bentley Ave
- 296 Herbert Ave
- 5 Elaine Ct
- 269 Park Ave
- 98 Madison Ave
- 24 Kensington Ave
- 35 Birch St
- 21 Fourth St
- 289 Main St Unit 2N
- 289 Main St Unit 9R
- 289 Main St Unit 6E
- 289 Main St Unit 10F
- 289 Main St Unit 4Q
- 289 Main St Unit 10N
- 205 Main St