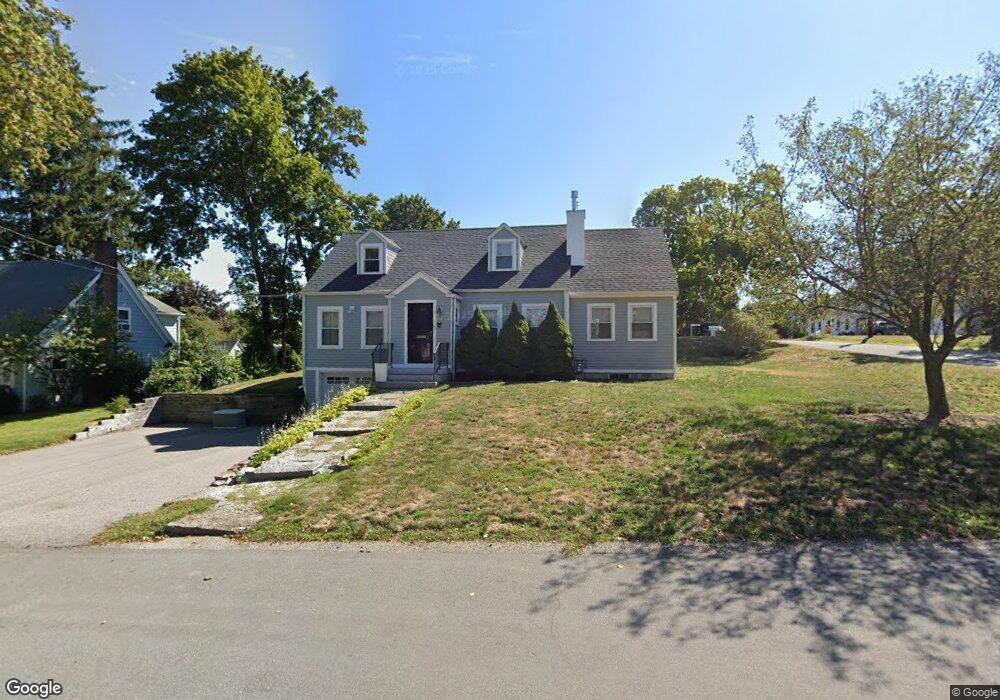
14 Colby Rd Hingham, MA 02043
Estimated Value: $1,061,624 - $1,203,000
4
Beds
1
Bath
1,587
Sq Ft
$733/Sq Ft
Est. Value
About This Home
This home is located at 14 Colby Rd, Hingham, MA 02043 and is currently estimated at $1,162,656, approximately $732 per square foot. 14 Colby Rd is a home located in Plymouth County with nearby schools including East Elementary School, Hingham Middle School, and Hingham High School.
Ownership History
Date
Name
Owned For
Owner Type
Purchase Details
Closed on
Jun 12, 2025
Sold by
Parnell Brian E and Merhill Nicole M
Bought by
Parnell & Merhill Ft and Parnell
Current Estimated Value
Purchase Details
Closed on
Jul 2, 2009
Sold by
Hall Stephen R
Bought by
Parnell Brian E and Merhill Nicole M
Home Financials for this Owner
Home Financials are based on the most recent Mortgage that was taken out on this home.
Original Mortgage
$465,811
Interest Rate
4.86%
Mortgage Type
Purchase Money Mortgage
Purchase Details
Closed on
Jun 11, 2004
Sold by
Piel Barbara A and Piel Bruce
Bought by
Hall Stephen R
Create a Home Valuation Report for This Property
The Home Valuation Report is an in-depth analysis detailing your home's value as well as a comparison with similar homes in the area
Purchase History
| Date | Buyer | Sale Price | Title Company |
|---|---|---|---|
| Parnell & Merhill Ft | -- | None Available | |
| Parnell & Merhill Ft | -- | None Available | |
| Parnell Brian E | $482,000 | -- | |
| Parnell Brian E | $482,000 | -- | |
| Hall Stephen R | $490,000 | -- | |
| Hall Stephen R | $490,000 | -- |
Source: Public Records
Mortgage History
| Date | Status | Borrower | Loan Amount |
|---|---|---|---|
| Previous Owner | Hall Stephen R | $455,026 | |
| Previous Owner | Hall Stephen R | $465,811 |
Source: Public Records
Tax History
| Year | Tax Paid | Tax Assessment Tax Assessment Total Assessment is a certain percentage of the fair market value that is determined by local assessors to be the total taxable value of land and additions on the property. | Land | Improvement |
|---|---|---|---|---|
| 2025 | $9,604 | $898,400 | $440,100 | $458,300 |
| 2024 | $9,201 | $848,000 | $440,100 | $407,900 |
| 2023 | $7,932 | $793,200 | $440,100 | $353,100 |
| 2022 | $7,509 | $649,600 | $366,700 | $282,900 |
| 2021 | $7,215 | $611,400 | $366,700 | $244,700 |
| 2020 | $7,049 | $611,400 | $366,700 | $244,700 |
| 2019 | $4,836 | $531,900 | $322,700 | $209,200 |
| 2018 | $5,851 | $497,100 | $322,700 | $174,400 |
| 2017 | $4,475 | $471,500 | $295,600 | $175,900 |
| 2016 | $5,713 | $457,400 | $281,500 | $175,900 |
| 2015 | $5,563 | $444,000 | $268,100 | $175,900 |
Source: Public Records
Map
Nearby Homes
Your Personal Tour Guide
Ask me questions while you tour the home.