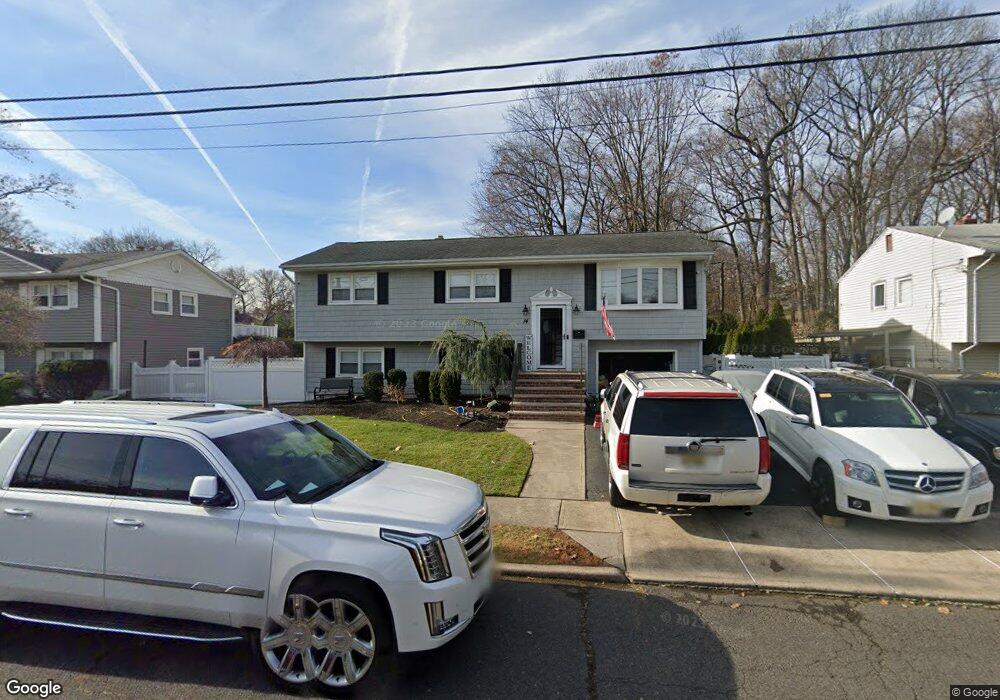
14 Cole Ct Dumont, NJ 07628
Estimated Value: $748,000 - $853,000
--
Bed
--
Bath
2,428
Sq Ft
$330/Sq Ft
Est. Value
About This Home
This home is located at 14 Cole Ct, Dumont, NJ 07628 and is currently estimated at $801,950, approximately $330 per square foot. 14 Cole Ct is a home located in Bergen County with nearby schools including Dumont High School and Institute For Educational Achievement.
Ownership History
Date
Name
Owned For
Owner Type
Purchase Details
Closed on
Jan 9, 2014
Sold by
Pardalis Marc S and Locantore Lyn A
Bought by
Orso Steven and Orso Amy
Current Estimated Value
Home Financials for this Owner
Home Financials are based on the most recent Mortgage that was taken out on this home.
Original Mortgage
$423,530
Interest Rate
3.96%
Mortgage Type
VA
Purchase Details
Closed on
May 27, 2003
Sold by
Spear Ethel
Bought by
Louis George and Louis Carol
Create a Home Valuation Report for This Property
The Home Valuation Report is an in-depth analysis detailing your home's value as well as a comparison with similar homes in the area
Home Values in the Area
Average Home Value in this Area
Purchase History
| Date | Buyer | Sale Price | Title Company |
|---|---|---|---|
| Orso Steven | $410,000 | Attorney | |
| Louis George | -- | -- |
Source: Public Records
Mortgage History
| Date | Status | Borrower | Loan Amount |
|---|---|---|---|
| Previous Owner | Orso Steven | $423,530 |
Source: Public Records
Tax History Compared to Growth
Tax History
| Year | Tax Paid | Tax Assessment Tax Assessment Total Assessment is a certain percentage of the fair market value that is determined by local assessors to be the total taxable value of land and additions on the property. | Land | Improvement |
|---|---|---|---|---|
| 2025 | $15,512 | $657,800 | $337,300 | $320,500 |
| 2024 | $15,130 | $381,600 | $193,800 | $187,800 |
| 2023 | $14,818 | $381,600 | $193,800 | $187,800 |
| 2022 | $14,507 | $373,600 | $193,800 | $179,800 |
| 2021 | $14,436 | $373,600 | $193,800 | $179,800 |
| 2020 | $14,044 | $373,600 | $193,800 | $179,800 |
| 2019 | $13,707 | $373,600 | $193,800 | $179,800 |
| 2018 | $13,427 | $373,600 | $193,800 | $179,800 |
| 2017 | $13,169 | $373,600 | $193,800 | $179,800 |
| 2016 | $12,863 | $373,600 | $193,800 | $179,800 |
| 2015 | $12,568 | $373,600 | $193,800 | $179,800 |
| 2014 | $12,321 | $373,600 | $193,800 | $179,800 |
Source: Public Records
Map
Nearby Homes