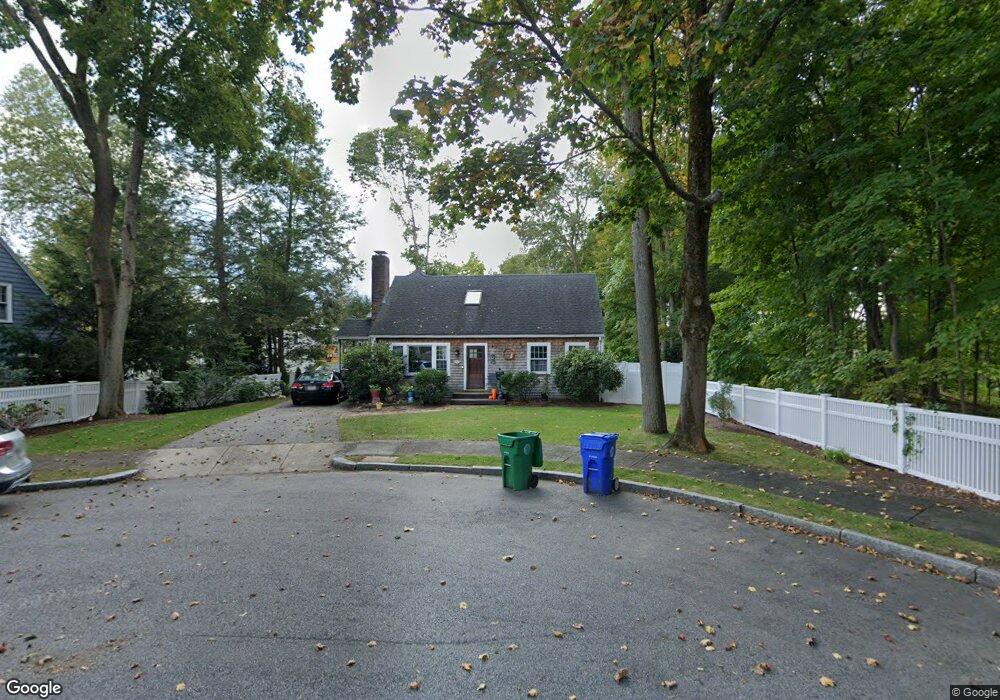
14 Colgate Cir Newton Lower Falls, MA 02462
Newton Lower Falls NeighborhoodEstimated Value: $1,241,000 - $1,728,000
5
Beds
4
Baths
2,483
Sq Ft
$604/Sq Ft
Est. Value
About This Home
This home is located at 14 Colgate Cir, Newton Lower Falls, MA 02462 and is currently estimated at $1,499,520, approximately $603 per square foot. 14 Colgate Cir is a home located in Middlesex County with nearby schools including Angier Elementary School, Charles E Brown Middle School, and Newton South High School.
Ownership History
Date
Name
Owned For
Owner Type
Purchase Details
Closed on
Apr 25, 2018
Sold by
Mcleod Cameron S and Mcleod Kathryn R
Bought by
14 Colgate Circle Nt
Current Estimated Value
Purchase Details
Closed on
Feb 7, 2011
Sold by
Mcleod Cameron S and Mcleod Kathryn R
Bought by
Mcleod Cameron S and Mcleod Kathryn R
Home Financials for this Owner
Home Financials are based on the most recent Mortgage that was taken out on this home.
Original Mortgage
$523,750
Interest Rate
4.82%
Mortgage Type
Purchase Money Mortgage
Purchase Details
Closed on
Jun 18, 1999
Sold by
Dunn Mary Est
Bought by
Mcleod Cameron E and Mcleod Kathryn R
Home Financials for this Owner
Home Financials are based on the most recent Mortgage that was taken out on this home.
Original Mortgage
$240,000
Interest Rate
6.99%
Mortgage Type
Purchase Money Mortgage
Create a Home Valuation Report for This Property
The Home Valuation Report is an in-depth analysis detailing your home's value as well as a comparison with similar homes in the area
Home Values in the Area
Average Home Value in this Area
Purchase History
| Date | Buyer | Sale Price | Title Company |
|---|---|---|---|
| 14 Colgate Circle Nt | -- | -- | |
| Mcleod Cameron S | -- | -- | |
| Mcleod Cameron E | $327,400 | -- |
Source: Public Records
Mortgage History
| Date | Status | Borrower | Loan Amount |
|---|---|---|---|
| Previous Owner | Mcleod Cameron S | $523,750 | |
| Previous Owner | Mcleod Cameron E | $240,000 | |
| Closed | Mcleod Cameron E | $54,750 |
Source: Public Records
Tax History
| Year | Tax Paid | Tax Assessment Tax Assessment Total Assessment is a certain percentage of the fair market value that is determined by local assessors to be the total taxable value of land and additions on the property. | Land | Improvement |
|---|---|---|---|---|
| 2025 | $14,643 | $1,494,200 | $821,800 | $672,400 |
| 2024 | $14,159 | $1,450,700 | $797,900 | $652,800 |
| 2023 | $13,460 | $1,322,200 | $614,800 | $707,400 |
| 2022 | $12,895 | $1,225,800 | $569,300 | $656,500 |
| 2021 | $12,443 | $1,156,400 | $537,100 | $619,300 |
| 2020 | $12,073 | $1,156,400 | $537,100 | $619,300 |
| 2019 | $11,732 | $1,122,700 | $521,500 | $601,200 |
| 2018 | $9,893 | $914,300 | $469,800 | $444,500 |
| 2017 | $9,591 | $862,500 | $443,200 | $419,300 |
| 2016 | $9,173 | $806,100 | $414,200 | $391,900 |
| 2015 | $8,747 | $753,400 | $387,100 | $366,300 |
Source: Public Records
Map
Nearby Homes
Your Personal Tour Guide
Ask me questions while you tour the home.