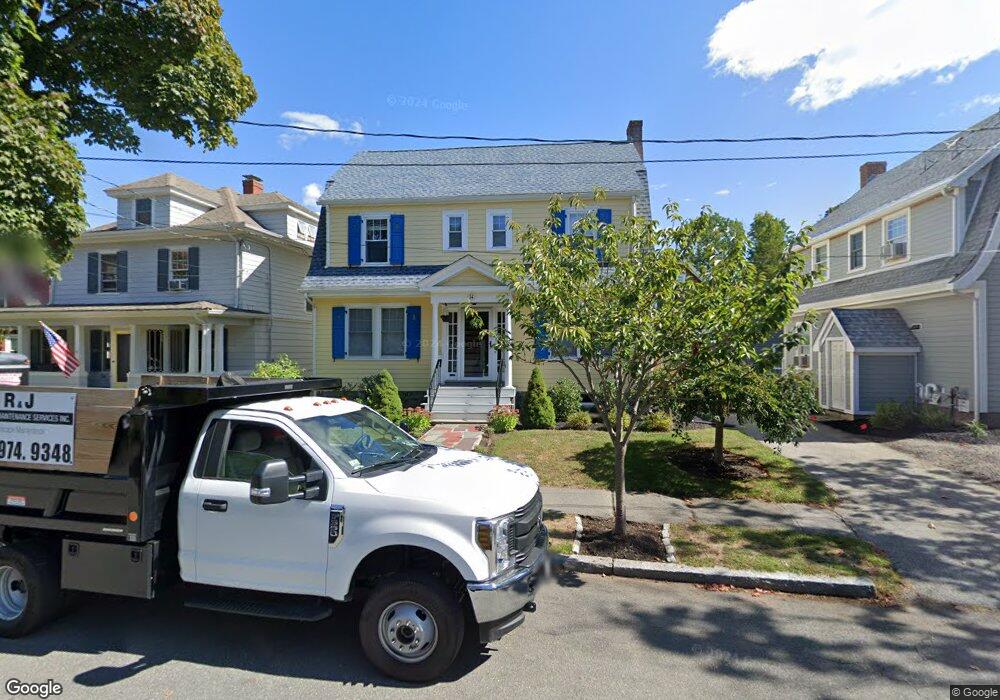
14 Conant Rd Marblehead, MA 01945
Estimated Value: $995,068 - $1,180,000
3
Beds
2
Baths
2,100
Sq Ft
$505/Sq Ft
Est. Value
About This Home
This home is located at 14 Conant Rd, Marblehead, MA 01945 and is currently estimated at $1,059,517, approximately $504 per square foot. 14 Conant Rd is a home located in Essex County with nearby schools including Marblehead High School, Devereux School, and Tower School.
Ownership History
Date
Name
Owned For
Owner Type
Purchase Details
Closed on
Mar 1, 2019
Sold by
Husgen Eric P and Husgen Kathryn P
Bought by
Goglick Lauren and Silbergleit Alex
Current Estimated Value
Home Financials for this Owner
Home Financials are based on the most recent Mortgage that was taken out on this home.
Original Mortgage
$568,000
Outstanding Balance
$496,298
Interest Rate
4.3%
Mortgage Type
New Conventional
Estimated Equity
$563,219
Purchase Details
Closed on
Jul 3, 2007
Sold by
Doren Alexander G and Doren Susan M
Bought by
Husgen Kathryn P
Purchase Details
Closed on
Dec 8, 1999
Sold by
Denious Peter L and Denious Kate E
Bought by
Doren Alexander H and Doren Susan M
Purchase Details
Closed on
Aug 8, 1997
Sold by
Luciano Anthony F and Luciano Megan B
Bought by
Denious Peter L and Denoius Kate E
Purchase Details
Closed on
Oct 16, 1995
Sold by
Rubinstein Ruth
Bought by
Luciano Anthony and Luciano Megan
Create a Home Valuation Report for This Property
The Home Valuation Report is an in-depth analysis detailing your home's value as well as a comparison with similar homes in the area
Home Values in the Area
Average Home Value in this Area
Purchase History
| Date | Buyer | Sale Price | Title Company |
|---|---|---|---|
| Goglick Lauren | $710,000 | -- | |
| Goglick Lauren | $710,000 | -- | |
| Husgen Kathryn P | $563,000 | -- | |
| Husgen Kathryn P | $563,000 | -- | |
| Doren Alexander H | $330,000 | -- | |
| Doren Alexander H | $330,000 | -- | |
| Denious Peter L | $262,000 | -- | |
| Denious Peter L | $262,000 | -- | |
| Luciano Anthony | $212,000 | -- | |
| Luciano Anthony | $212,000 | -- |
Source: Public Records
Mortgage History
| Date | Status | Borrower | Loan Amount |
|---|---|---|---|
| Open | Goglick Lauren | $568,000 | |
| Closed | Goglick Lauren | $568,000 | |
| Previous Owner | Luciano Anthony | $417,000 |
Source: Public Records
Tax History
| Year | Tax Paid | Tax Assessment Tax Assessment Total Assessment is a certain percentage of the fair market value that is determined by local assessors to be the total taxable value of land and additions on the property. | Land | Improvement |
|---|---|---|---|---|
| 2025 | $7,691 | $849,800 | $517,900 | $331,900 |
| 2024 | $7,511 | $838,300 | $517,900 | $320,400 |
| 2023 | $7,278 | $727,800 | $471,800 | $256,000 |
| 2022 | $7,112 | $676,000 | $425,800 | $250,200 |
| 2021 | $6,645 | $637,700 | $391,300 | $246,400 |
| 2020 | $6,505 | $626,100 | $391,300 | $234,800 |
| 2019 | $6,250 | $581,900 | $356,700 | $225,200 |
| 2018 | $6,159 | $558,900 | $333,700 | $225,200 |
| 2017 | $5,900 | $535,900 | $310,700 | $225,200 |
| 2016 | $5,693 | $512,900 | $287,700 | $225,200 |
| 2015 | $5,363 | $484,000 | $264,700 | $219,300 |
| 2014 | $4,997 | $450,600 | $241,700 | $208,900 |
Source: Public Records
Map
Nearby Homes
- 48 Bellevue Rd
- 212 Humphrey St Unit 205
- 11 Angenica Terrace
- 2 Ocean Ave
- 25 Tedesco St
- 1002 Paradise Rd Unit PHE
- 1004 Paradise Rd Unit 1L
- 12 Pickwick Rd
- 4 Dean Rd
- 49 Weatherly Dr
- 30 Weatherly Dr
- 11 Weatherly Dr
- 71 Walnut Rd
- 3 Didio Dr
- 445 Essex St Unit 304
- 441 Essex St Unit 302
- 35 Alden Rd
- 22 Hemenway Rd
- 28 Surrey Rd
- 50 Mountwood Rd
Your Personal Tour Guide
Ask me questions while you tour the home.