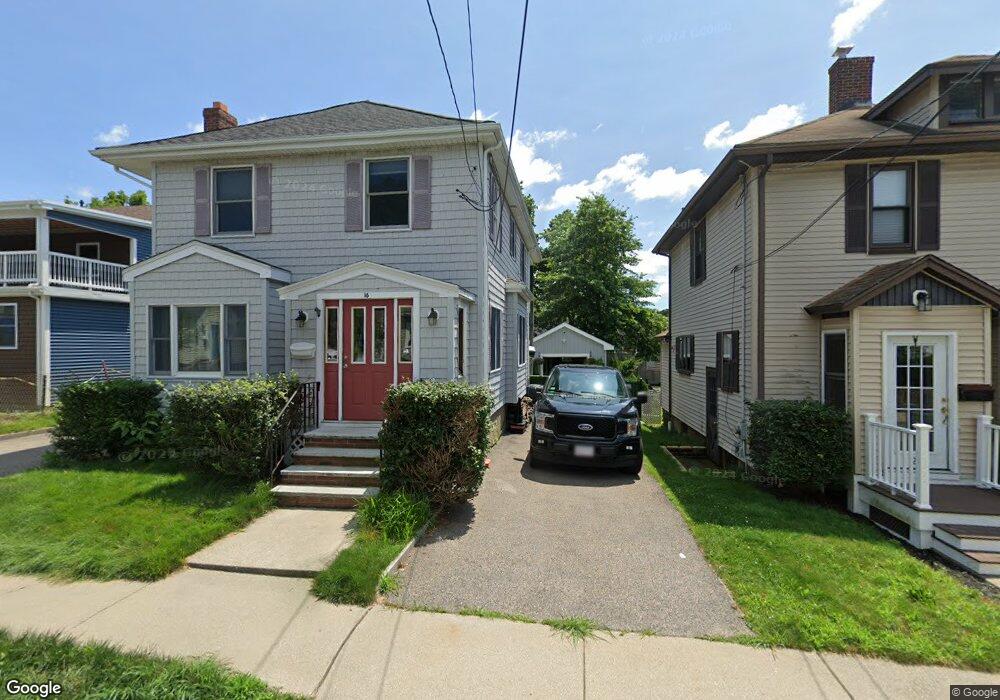
14 Connell St Quincy, MA 02169
West Quincy NeighborhoodEstimated Value: $741,000 - $842,000
3
Beds
1
Bath
2,040
Sq Ft
$381/Sq Ft
Est. Value
About This Home
This home is located at 14 Connell St, Quincy, MA 02169 and is currently estimated at $776,462, approximately $380 per square foot. 14 Connell St is a home located in Norfolk County with nearby schools including Charles A. Bernazzani Elementary School, Central Middle School, and North Quincy High School.
Ownership History
Date
Name
Owned For
Owner Type
Purchase Details
Closed on
Jul 30, 1993
Sold by
Chepetsky Joseph P Est
Bought by
Nabstedt James L and Nabstedt Debra E
Current Estimated Value
Home Financials for this Owner
Home Financials are based on the most recent Mortgage that was taken out on this home.
Original Mortgage
$81,000
Interest Rate
7.32%
Mortgage Type
Purchase Money Mortgage
Create a Home Valuation Report for This Property
The Home Valuation Report is an in-depth analysis detailing your home's value as well as a comparison with similar homes in the area
Home Values in the Area
Average Home Value in this Area
Purchase History
| Date | Buyer | Sale Price | Title Company |
|---|---|---|---|
| Nabstedt James L | $90,000 | -- |
Source: Public Records
Mortgage History
| Date | Status | Borrower | Loan Amount |
|---|---|---|---|
| Open | Nabstedt James L | $166,050 | |
| Closed | Nabstedt James L | $123,750 | |
| Closed | Nabstedt James L | $81,000 |
Source: Public Records
Tax History
| Year | Tax Paid | Tax Assessment Tax Assessment Total Assessment is a certain percentage of the fair market value that is determined by local assessors to be the total taxable value of land and additions on the property. | Land | Improvement |
|---|---|---|---|---|
| 2025 | $7,802 | $676,700 | $298,800 | $377,900 |
| 2024 | $7,380 | $654,800 | $284,500 | $370,300 |
| 2023 | $6,852 | $615,600 | $271,000 | $344,600 |
| 2022 | $6,518 | $544,100 | $216,800 | $327,300 |
| 2021 | $6,458 | $532,000 | $216,800 | $315,200 |
| 2020 | $6,399 | $514,800 | $216,800 | $298,000 |
| 2019 | $6,186 | $492,900 | $210,500 | $282,400 |
| 2018 | $6,080 | $455,800 | $194,900 | $260,900 |
| 2017 | $5,980 | $422,000 | $185,600 | $236,400 |
| 2016 | $5,576 | $388,300 | $168,700 | $219,600 |
| 2015 | $5,263 | $360,500 | $159,200 | $201,300 |
| 2014 | $5,118 | $344,400 | $159,200 | $185,200 |
Source: Public Records
Map
Nearby Homes
- 10 White St
- 41 Wallace Rd
- 406 Beale St
- 135 Willard St Unit 8
- 123 Piermont St
- 440 Granite Ave Unit 201
- 1 Cityview Ln Unit 506
- 1 Cityview Ln Unit 709
- 141 Gardiner Rd
- 211 Copeland St
- 71 Governors Rd
- 154 N Central Ave
- 72 Oakland Ave
- 200 Adams St
- 46 Suomi Rd Unit 46
- 46 Suomi Rd
- 12 Nelson St
- 197 Hobart St
- 57 Buckley St
- 459 Willard St Unit 303