Estimated Value: $308,437 - $336,000
--
Bed
3
Baths
1,681
Sq Ft
$189/Sq Ft
Est. Value
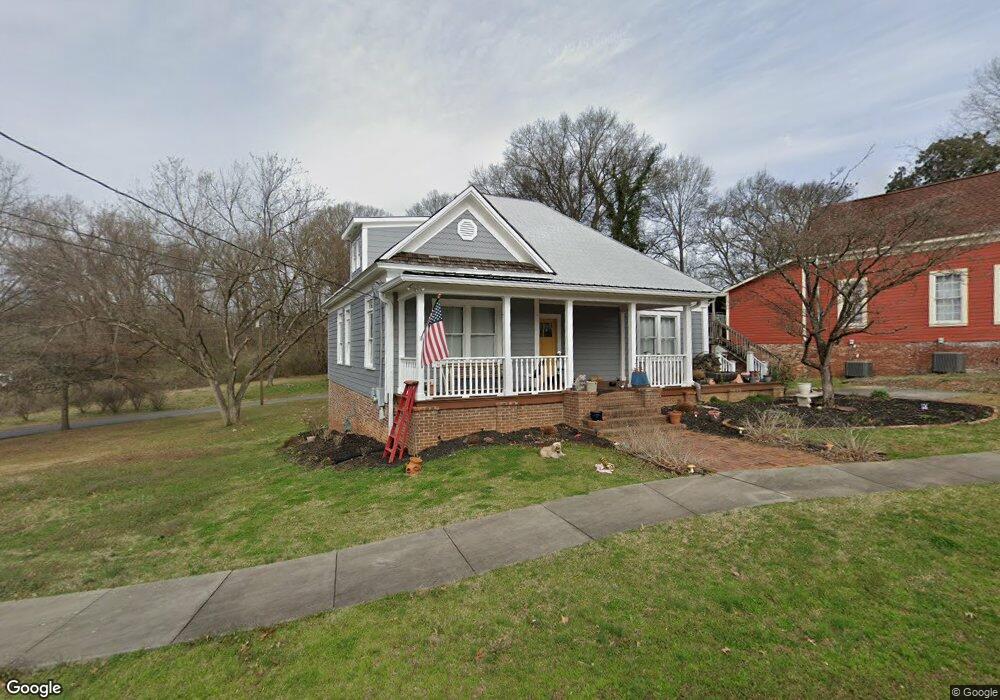
About This Home
This home is located at 14 Coral Ave SW Unit pt51 & 52, Rome, GA 30161 and is currently estimated at $318,359, approximately $189 per square foot. 14 Coral Ave SW Unit pt51 & 52 is a home located in Floyd County with nearby schools including Dan McCarty Middle School, Rome High School, and St. Mary School.
Ownership History
Date
Name
Owned For
Owner Type
Purchase Details
Closed on
Jan 21, 2022
Sold by
Sinnock Jeff D
Bought by
Rohner Charles D and Rohner Trina V
Current Estimated Value
Home Financials for this Owner
Home Financials are based on the most recent Mortgage that was taken out on this home.
Original Mortgage
$190,000
Outstanding Balance
$175,873
Interest Rate
3.45%
Mortgage Type
Cash
Estimated Equity
$142,486
Purchase Details
Closed on
Oct 9, 2020
Sold by
Long Marcus H
Bought by
Sinnock Jeff D and Sinnock Kim
Home Financials for this Owner
Home Financials are based on the most recent Mortgage that was taken out on this home.
Original Mortgage
$64,500
Interest Rate
2.8%
Mortgage Type
New Conventional
Purchase Details
Closed on
Jan 2, 2020
Sold by
Smith Michael Paul
Bought by
Long Marcus H
Home Financials for this Owner
Home Financials are based on the most recent Mortgage that was taken out on this home.
Original Mortgage
$128,000
Interest Rate
3.6%
Mortgage Type
New Conventional
Purchase Details
Closed on
Sep 22, 2008
Sold by
Beckum Jeanne Daniel
Bought by
Smith Kelly and Smith Michael Paul
Home Financials for this Owner
Home Financials are based on the most recent Mortgage that was taken out on this home.
Original Mortgage
$114,400
Interest Rate
6.45%
Mortgage Type
New Conventional
Purchase Details
Closed on
Apr 4, 2008
Sold by
Not Provided
Bought by
Smith Kelly and Smith Michael Paul
Purchase Details
Closed on
Dec 7, 2006
Sold by
Not Provided
Bought by
Smith Kelly and Smith Michael Paul
Home Financials for this Owner
Home Financials are based on the most recent Mortgage that was taken out on this home.
Original Mortgage
$77,000
Interest Rate
6.31%
Mortgage Type
New Conventional
Purchase Details
Closed on
Jul 2, 1998
Sold by
Commercial Credit Plan Incorporated
Bought by
Brown Jeff
Purchase Details
Closed on
May 5, 1998
Sold by
Thrash Shirley J
Bought by
Commercial Credit Plan Incorporated
Purchase Details
Closed on
Apr 28, 1994
Sold by
Williams Jerry L
Bought by
Thrash Shirley J
Purchase Details
Closed on
Dec 1, 1983
Bought by
P and R
Purchase Details
Closed on
Jan 11, 1982
Bought by
P and R
Purchase Details
Closed on
May 19, 1978
Bought by
P and R
Purchase Details
Closed on
Mar 1, 1976
Sold by
Bailey John E
Bought by
Williams Jerry L
Purchase Details
Closed on
Aug 6, 1972
Sold by
Williams Bruce F
Bought by
Bailey John E
Purchase Details
Closed on
Oct 8, 1969
Sold by
Burnes N N Mrs
Bought by
Williams Bruce F
Purchase Details
Closed on
Jan 1, 1901
Bought by
Burnes N N Mrs
Create a Home Valuation Report for This Property
The Home Valuation Report is an in-depth analysis detailing your home's value as well as a comparison with similar homes in the area
Home Values in the Area
Average Home Value in this Area
Purchase History
| Date | Buyer | Sale Price | Title Company |
|---|---|---|---|
| Rohner Charles D | $290,000 | -- | |
| Sinnock Jeff D | $199,500 | -- | |
| Long Marcus H | $160,000 | -- | |
| Smith Kelly | $143,000 | -- | |
| Smith Kelly | $195,000 | -- | |
| Beckum Jeanne D | $195,000 | -- | |
| Smith Kelly | $12,000 | -- | |
| Brown Jeff | $15,000 | -- | |
| Commercial Credit Plan Incorporated | $21,300 | -- | |
| Thrash Shirley J | $16,500 | -- | |
| P | -- | -- | |
| P | -- | -- | |
| P | -- | -- | |
| Williams Jerry L | -- | -- | |
| Bailey John E | -- | -- | |
| Williams Bruce F | $3,800 | -- | |
| Burnes N N Mrs | -- | -- |
Source: Public Records
Mortgage History
| Date | Status | Borrower | Loan Amount |
|---|---|---|---|
| Open | Rohner Charles D | $190,000 | |
| Previous Owner | Sinnock Jeff D | $64,500 | |
| Previous Owner | Long Marcus H | $128,000 | |
| Previous Owner | Smith Kelly | $114,400 | |
| Previous Owner | Smith Kelly | $77,000 |
Source: Public Records
Tax History Compared to Growth
Tax History
| Year | Tax Paid | Tax Assessment Tax Assessment Total Assessment is a certain percentage of the fair market value that is determined by local assessors to be the total taxable value of land and additions on the property. | Land | Improvement |
|---|---|---|---|---|
| 2024 | $3,970 | $114,345 | $8,899 | $105,446 |
| 2023 | $3,934 | $110,622 | $7,910 | $102,712 |
| 2022 | $3,269 | $89,575 | $6,427 | $83,148 |
| 2021 | $3,055 | $82,339 | $6,427 | $75,912 |
| 2020 | $2,723 | $72,773 | $4,944 | $67,829 |
| 2019 | $2,563 | $69,230 | $4,944 | $64,286 |
| 2018 | $2,429 | $65,616 | $4,944 | $60,672 |
| 2017 | $2,279 | $61,564 | $4,944 | $56,620 |
| 2016 | $2,247 | $60,495 | $4,920 | $55,575 |
| 2015 | -- | $60,495 | $4,920 | $55,575 |
| 2014 | -- | $60,495 | $4,920 | $55,575 |
Source: Public Records
Map
Nearby Homes
- 2 Fair St SW
- 2 Coral Ave SW
- 702 River Ave SW
- 801 Maple Ave SW
- 2 E 10th St SW
- 166 E 11th St SW
- 162 E 11th St SE
- 164 E 11th St SE
- 168 E 11th St SE
- 9 Eastridge Ct SW
- 170 E 11th St SW
- 206 E 4th St
- 31 Notasulga Dr SW
- 320 E 3rd Ave
- 13 N Blanche Ave SW
- 115 Lookout Cir SW
- 113 Lookout Cir SW
- 515 S Broad St SW
- 14 Coral Ave SW
- 14 Coral Ave SW
- 7 Queen St SW
- 12 Coral Ave SW
- 35 Queen St SW
- 10 Coral Ave SW
- 15 Coral Ave SW
- 17 Coral Ave SW
- 3 Queen St SW Unit 3A3B 5A5B
- 23 Coral Ave SW
- 3 Fair St SW
- 3 Fair St SW Unit A
- 1 Queen St SW
- 31 E 6th St SW
- 8 Coral Ave SW
- 1 Fair St SW Unit A
- 1 Fair St SW Unit B
- 1 Fair St SW
- 0 Coral Ave SW Unit 8588530
- 0 Coral Ave SW Unit 8563160