14 Cornauba St Roslindale, MA 02131
Roslindale NeighborhoodEstimated Value: $755,000 - $835,266
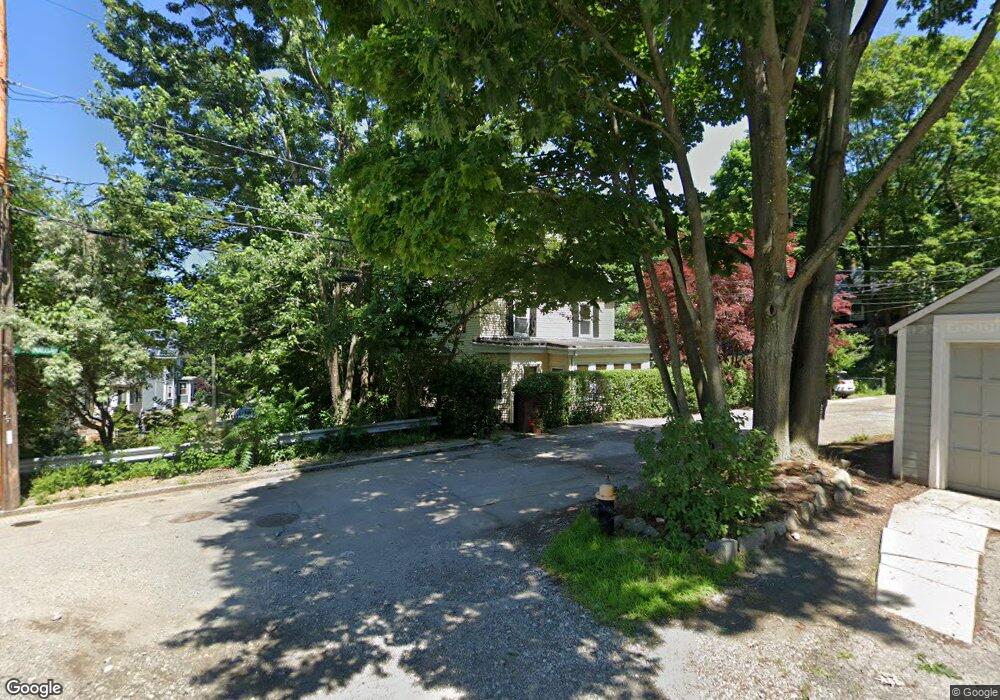
About This Home
This home is located at 14 Cornauba St, Roslindale, MA 02131 and is currently estimated at $801,817, approximately $566 per square foot. 14 Cornauba St is a home located in Suffolk County with nearby schools including Beethoven Elementary School, Charles H. Taylor Elementary School, and Blackstone Elementary.
Ownership History
We collect this data history from publicly available records. To have your information removed, we recommend requesting removal directly through your county’s website.
Purchase Details
Purchase Details
Home Values in the Area
Average Home Value in this Area
Purchase History
We collect this data history from publicly available records. To have your information removed, we recommend requesting removal directly through your county’s website.
| Date | Buyer | Sale Price | Title Company |
|---|---|---|---|
| $75,443 | -- | ||
| $134,000 | -- |
Mortgage History
We collect this data history from publicly available records. To have your information removed, we recommend requesting removal directly through your county’s website.
| Date | Status | Borrower | Loan Amount |
|---|---|---|---|
| Open | $160,700 | ||
| Closed | $183,000 | ||
| Closed | $199,300 | ||
| Closed | $198,200 | ||
| Closed | $199,000 | ||
| Previous Owner | $106,000 | ||
| Previous Owner | $106,500 |
Tax History
We collect this data history from publicly available records. To have your information removed, we recommend requesting removal directly through your county’s website.
| Year | Tax Paid | Tax Assessment Tax Assessment Total Assessment is a certain percentage of the fair market value that is determined by local assessors to be the total taxable value of land and additions on the property. | Land | Improvement |
|---|---|---|---|---|
| 2025 | $8,413 | $726,500 | $223,300 | $503,200 |
| 2024 | $7,584 | $695,800 | $197,700 | $498,100 |
| 2023 | $6,982 | $650,100 | $184,700 | $465,400 |
| 2022 | $6,551 | $602,100 | $171,100 | $431,000 |
| 2021 | $6,177 | $578,900 | $164,500 | $414,400 |
| 2020 | $5,765 | $545,900 | $159,600 | $386,300 |
| 2019 | $5,476 | $519,500 | $126,300 | $393,200 |
| 2018 | $5,183 | $494,600 | $126,300 | $368,300 |
| 2017 | $4,943 | $466,800 | $126,300 | $340,500 |
| 2016 | $4,710 | $428,200 | $126,300 | $301,900 |
| 2015 | $4,720 | $389,800 | $122,200 | $267,600 |
| 2014 | $4,453 | $354,000 | $122,200 | $231,800 |
Map
- 68 Rowe St Unit 2
- 68 Rowe St Unit 3
- 68 Rowe St Unit 1
- 146 Poplar St
- 61 Cummins Hwy Unit 2
- 67 Florence St Unit 1
- 391 Poplar St
- 36-38 Florence St Unit 38
- 36 Brookdale St
- 18 Kittredge St Unit 1
- 25 Pinedale Rd Unit 1
- 624 Hyde Park Ave Unit C3
- 2 Florence St
- 969 Canterbury St
- 3915 Washington St Unit 1
- 3915 Washington St
- 46 Murray Hill Rd
- 4295-4297 Washington St Unit 4
- 60 Stella Rd
- 699 Hyde Park Ave Unit 6
- 106 Hawthorne St
- 26 Cornauba St
- 13 Cornauba St
- 119 Hawthorne St
- 4 Hawthorne Terrace
- 8 Cornauba St
- 9 Cornauba St
- 9 Cornauba Street Extension Unit 11
- 9 Cornauba St Unit 9
- 9-11 Cornauba Street Extension Unit 1
- 9 Cornauba St Unit 2
- 9 Cornauba St Unit 1
- 9-11 Cornauba Street Extension
- 19 Cornauba St
- 10 Cornauba St Unit 2
- 10 Cornauba St Unit 1
- 10 Cornauba St
- 111 Hawthorne St
- 102 Hawthorne St
- 6 Cornauba St
Ask me questions while you tour the home.