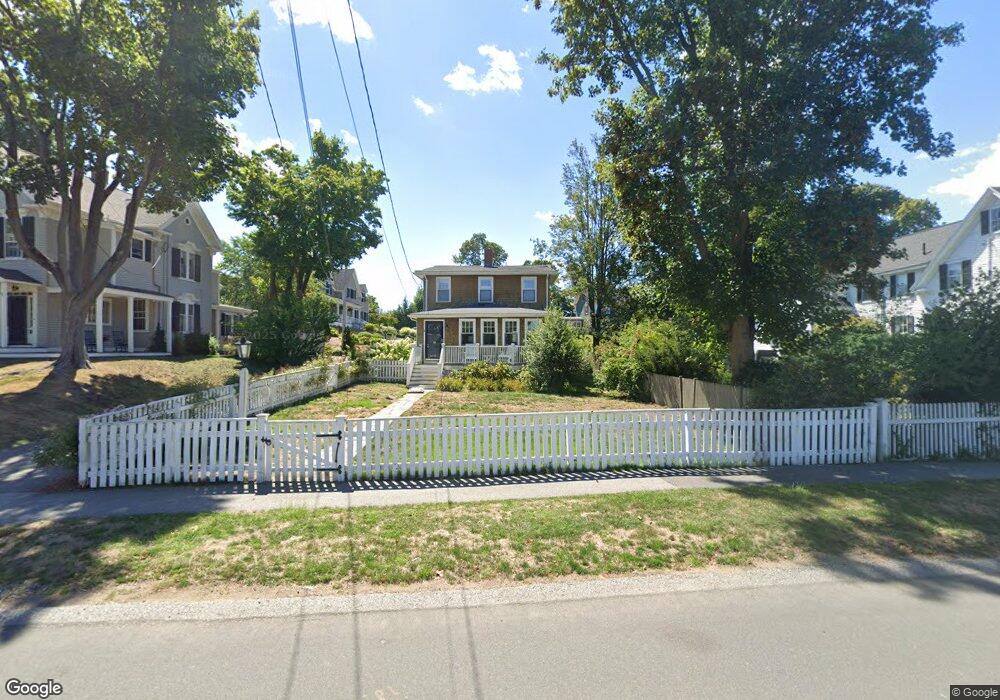
14 Cottage St Hingham, MA 02043
Crow Point NeighborhoodEstimated Value: $1,093,000 - $1,443,000
3
Beds
2
Baths
1,805
Sq Ft
$672/Sq Ft
Est. Value
About This Home
This home is located at 14 Cottage St, Hingham, MA 02043 and is currently estimated at $1,213,721, approximately $672 per square foot. 14 Cottage St is a home located in Plymouth County with nearby schools including William L. Foster Elementary School, St. Paul Elementary School, and Derby Academy.
Ownership History
Date
Name
Owned For
Owner Type
Purchase Details
Closed on
Oct 30, 2001
Sold by
Ohearne Brian and Moynihan Kerry R
Bought by
Warneck Stephen C and Warneck Victoria R
Current Estimated Value
Purchase Details
Closed on
Mar 31, 1998
Sold by
Niland Marie and Harris Anna-Liza
Bought by
Ohearne Brian R and Moynihan Kerry R
Create a Home Valuation Report for This Property
The Home Valuation Report is an in-depth analysis detailing your home's value as well as a comparison with similar homes in the area
Home Values in the Area
Average Home Value in this Area
Purchase History
| Date | Buyer | Sale Price | Title Company |
|---|---|---|---|
| Warneck Stephen C | $525,000 | -- | |
| Ohearne Brian R | $290,000 | -- |
Source: Public Records
Mortgage History
| Date | Status | Borrower | Loan Amount |
|---|---|---|---|
| Open | Ohearne Brian R | $84,400 | |
| Open | Ohearne Brian R | $467,000 |
Source: Public Records
Tax History Compared to Growth
Tax History
| Year | Tax Paid | Tax Assessment Tax Assessment Total Assessment is a certain percentage of the fair market value that is determined by local assessors to be the total taxable value of land and additions on the property. | Land | Improvement |
|---|---|---|---|---|
| 2025 | $9,718 | $909,100 | $489,400 | $419,700 |
| 2024 | $8,920 | $822,100 | $489,400 | $332,700 |
| 2023 | $8,063 | $806,300 | $489,400 | $316,900 |
| 2022 | $8,378 | $724,700 | $407,800 | $316,900 |
| 2021 | $0 | $704,200 | $424,800 | $279,400 |
| 2020 | $2,043 | $735,900 | $424,800 | $311,100 |
| 2019 | $2,057 | $716,000 | $424,800 | $291,200 |
| 2018 | $2,048 | $705,000 | $424,800 | $280,200 |
| 2017 | $7,909 | $645,600 | $393,900 | $251,700 |
| 2016 | $7,778 | $622,700 | $375,200 | $247,500 |
| 2015 | $7,445 | $594,200 | $357,300 | $236,900 |
Source: Public Records
Map
Nearby Homes