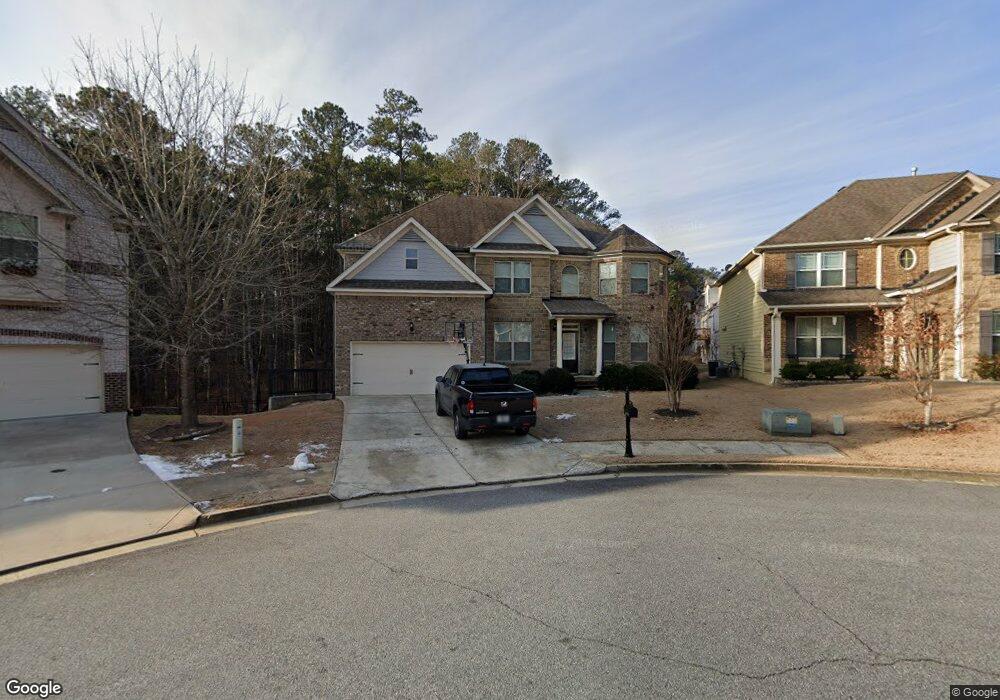
14 Creekwater Overlook Acworth, GA 30101
Cedarcrest NeighborhoodEstimated Value: $581,049 - $688,000
5
Beds
4
Baths
3,632
Sq Ft
$172/Sq Ft
Est. Value
About This Home
This home is located at 14 Creekwater Overlook, Acworth, GA 30101 and is currently estimated at $625,012, approximately $172 per square foot. 14 Creekwater Overlook is a home with nearby schools including Floyd L. Shelton Elementary School at Crossroad, Sammy Mcclure Sr. Middle School, and North Paulding High School.
Ownership History
Date
Name
Owned For
Owner Type
Purchase Details
Closed on
Aug 5, 2016
Sold by
Stephen
Bought by
Kirkpatrick Stephen G and Kirkpatrick Kimberly Harless
Current Estimated Value
Home Financials for this Owner
Home Financials are based on the most recent Mortgage that was taken out on this home.
Original Mortgage
$258,300
Outstanding Balance
$205,626
Interest Rate
3.41%
Mortgage Type
New Conventional
Estimated Equity
$419,386
Purchase Details
Closed on
Oct 31, 2013
Sold by
Peachtree Communities At A
Bought by
Kirkpatrick Stephen and Harless Kimberly
Home Financials for this Owner
Home Financials are based on the most recent Mortgage that was taken out on this home.
Original Mortgage
$258,709
Interest Rate
4.23%
Mortgage Type
New Conventional
Purchase Details
Closed on
Apr 24, 2013
Sold by
Arthur Hills Community Llc
Bought by
Peachtree Communities At Arthu
Create a Home Valuation Report for This Property
The Home Valuation Report is an in-depth analysis detailing your home's value as well as a comparison with similar homes in the area
Home Values in the Area
Average Home Value in this Area
Purchase History
| Date | Buyer | Sale Price | Title Company |
|---|---|---|---|
| Kirkpatrick Stephen G | -- | -- | |
| Kirkpatrick Stephen | $272,325 | -- | |
| Peachtree Communities At Arthu | $106,000 | -- |
Source: Public Records
Mortgage History
| Date | Status | Borrower | Loan Amount |
|---|---|---|---|
| Open | Kirkpatrick Stephen G | $258,300 | |
| Previous Owner | Kirkpatrick Stephen | $258,709 |
Source: Public Records
Tax History Compared to Growth
Tax History
| Year | Tax Paid | Tax Assessment Tax Assessment Total Assessment is a certain percentage of the fair market value that is determined by local assessors to be the total taxable value of land and additions on the property. | Land | Improvement |
|---|---|---|---|---|
| 2024 | $5,614 | $228,920 | $26,000 | $202,920 |
| 2023 | $5,691 | $220,840 | $26,000 | $194,840 |
| 2022 | $4,848 | $187,844 | $26,000 | $161,844 |
| 2021 | $4,374 | $152,364 | $26,000 | $126,364 |
| 2020 | $4,167 | $142,164 | $26,000 | $116,164 |
| 2019 | $4,199 | $141,208 | $26,000 | $115,208 |
| 2018 | $3,722 | $125,400 | $28,000 | $97,400 |
| 2017 | $3,569 | $118,684 | $28,000 | $90,684 |
| 2016 | $3,178 | $106,960 | $28,000 | $78,960 |
| 2015 | $3,032 | $100,360 | $28,000 | $72,360 |
| 2014 | $2,982 | $96,324 | $28,000 | $68,324 |
| 2013 | -- | $4,480 | $4,480 | $0 |
Source: Public Records
Map
Nearby Homes
- 184 Clubhouse Crossing
- 80 Lanier Ridge
- 35 N Springs Way
- 232 Clubhouse Crossing
- 140 Arthur Hills Dr
- 416 Fairway Dr
- 47 Vine Creek Ln
- 55 Clubhouse Way
- 26 Riverclub Rd
- 16 Hawkstone Ct
- 283 Hickory Pointe Dr
- 174 Timber Creek #176 Ln SW
- 176 Nightwind Trace
- 197 Hickory Pointe Dr
- 88 Water Oak Dr
- 76 Ashdowne Way
- 51 Water Oak Dr
- 110 Fairway Dr
- 19 Creekwater Overlook
- 19 Creekwater
- 96 Fairway Dr
- 15 Creekwater Overlook
- 74 Fairway Dr
- 150 Fairway Dr
- 66 Fairway Dr
- 121 Fairway Dr
- 113 Fairway Dr
- 46 Clubhouse Crossing
- 28 Clubhouse Crossing
- 139 Fairway Dr
- 151 Fairway Dr
- 105 Fairway Dr
- 0 Fairway Dr Unit 8183778
- 0 Fairway Dr Unit 8150943
- 0 Fairway Dr Unit 8948966
- 0 Fairway Dr Unit 8798787
- 0 Fairway Dr Unit 7375586