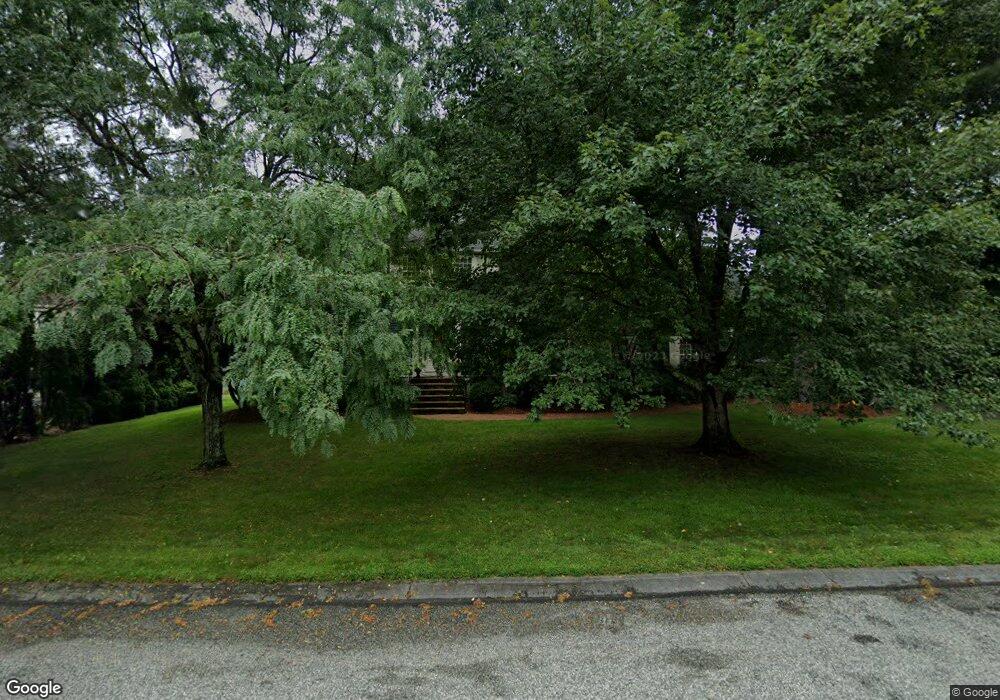
14 Crestview Ave Medway, MA 02053
Estimated Value: $865,739 - $1,053,000
4
Beds
3
Baths
2,715
Sq Ft
$354/Sq Ft
Est. Value
About This Home
This home is located at 14 Crestview Ave, Medway, MA 02053 and is currently estimated at $960,685, approximately $353 per square foot. 14 Crestview Ave is a home located in Norfolk County with nearby schools including John D. McGovern Elementary School, Burke-Memorial Elementary, and Medway Middle School.
Ownership History
Date
Name
Owned For
Owner Type
Purchase Details
Closed on
Nov 8, 2016
Sold by
Davenport Donna and Davenport Theodore
Bought by
Donna M Davenport T
Current Estimated Value
Home Financials for this Owner
Home Financials are based on the most recent Mortgage that was taken out on this home.
Original Mortgage
$417,000
Outstanding Balance
$335,411
Interest Rate
3.48%
Mortgage Type
New Conventional
Estimated Equity
$625,274
Purchase Details
Closed on
Apr 8, 2013
Sold by
Davenport Theodore J and Davenport Donna M
Bought by
Donna M Davenport T and Davenport Donna M
Home Financials for this Owner
Home Financials are based on the most recent Mortgage that was taken out on this home.
Original Mortgage
$311,500
Interest Rate
3.44%
Mortgage Type
New Conventional
Purchase Details
Closed on
Feb 21, 2013
Sold by
Donna M Davenport T and Davenport Donna M
Bought by
Davenport Donna M and Davenport Theodore J
Home Financials for this Owner
Home Financials are based on the most recent Mortgage that was taken out on this home.
Original Mortgage
$311,500
Interest Rate
3.44%
Mortgage Type
New Conventional
Purchase Details
Closed on
May 18, 2006
Sold by
Davenport Theodore J and Davenport Donna M
Bought by
Donna M Davenport T and Davenport Donna M
Purchase Details
Closed on
Nov 30, 1990
Sold by
Coras Tr Gregory J
Bought by
Davenport Theodore J
Create a Home Valuation Report for This Property
The Home Valuation Report is an in-depth analysis detailing your home's value as well as a comparison with similar homes in the area
Home Values in the Area
Average Home Value in this Area
Purchase History
| Date | Buyer | Sale Price | Title Company |
|---|---|---|---|
| Donna M Davenport T | -- | -- | |
| Davenport Theodore | -- | -- | |
| Donna M Davenport T | -- | -- | |
| Davenport Donna M | -- | -- | |
| Donna M Davenport T | -- | -- | |
| Davenport Theodore J | $234,000 | -- |
Source: Public Records
Mortgage History
| Date | Status | Borrower | Loan Amount |
|---|---|---|---|
| Open | Davenport Theodore | $417,000 | |
| Closed | Donna M Davenport T | $417,000 | |
| Previous Owner | Davenport Donna M | $311,500 | |
| Previous Owner | Davenport Theodore J | $70,000 | |
| Previous Owner | Davenport Theodore J | $349,002 | |
| Previous Owner | Davenport Theodore J | $193,000 |
Source: Public Records
Tax History Compared to Growth
Tax History
| Year | Tax Paid | Tax Assessment Tax Assessment Total Assessment is a certain percentage of the fair market value that is determined by local assessors to be the total taxable value of land and additions on the property. | Land | Improvement |
|---|---|---|---|---|
| 2025 | $10,555 | $740,700 | $323,400 | $417,300 |
| 2024 | $10,666 | $740,700 | $323,400 | $417,300 |
| 2023 | $10,554 | $662,100 | $294,300 | $367,800 |
| 2022 | $9,750 | $575,900 | $217,600 | $358,300 |
| 2021 | $9,496 | $543,900 | $203,100 | $340,800 |
| 2020 | $9,461 | $540,600 | $203,100 | $337,500 |
| 2019 | $8,833 | $520,500 | $194,800 | $325,700 |
| 2018 | $8,904 | $504,200 | $186,600 | $317,600 |
| 2017 | $8,815 | $491,900 | $182,400 | $309,500 |
| 2016 | $8,198 | $452,700 | $167,900 | $284,800 |
| 2015 | $8,130 | $445,700 | $165,800 | $279,900 |
| 2014 | $7,862 | $417,300 | $165,800 | $251,500 |
Source: Public Records
Map
Nearby Homes
- 280 Village St Unit D2
- 4 Shaw St
- 22 Sunset Dr
- 20 Broad St Unit 6
- 20 Broad St Unit A
- 20 Broad St Unit 4
- 28 Wellington St
- 14 Sanford St Unit 15
- 3 Meryl St
- 9 Sanford St
- 176 Main St Unit 3
- 14 Heritage Dr
- 50 Main St
- 12 Lovering St
- 0 Elm St
- 106 Holliston St
- 841 Lincoln St
- 21 Riverside Rd
- 7 Gloucester Dr
- 36 Lovering St