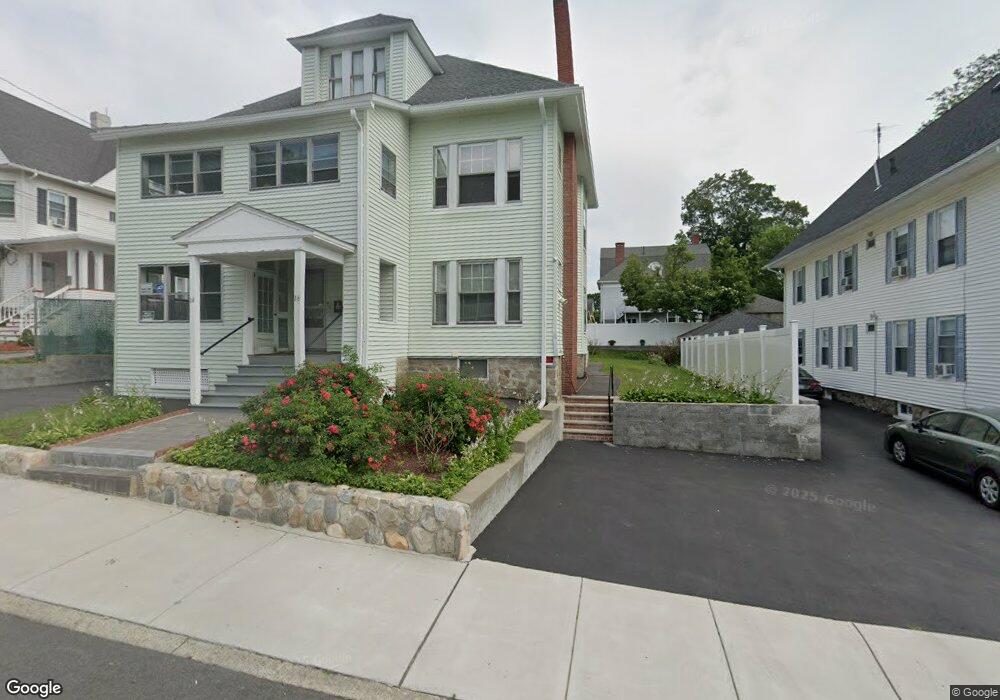
14 Custer St Lawrence, MA 01841
Prospect Hill-Back Bay NeighborhoodEstimated Value: $605,000 - $903,000
6
Beds
2
Baths
3,600
Sq Ft
$204/Sq Ft
Est. Value
About This Home
This home is located at 14 Custer St, Lawrence, MA 01841 and is currently estimated at $735,377, approximately $204 per square foot. 14 Custer St is a home located in Essex County with nearby schools including School For Exceptional Studies, Community Day Charter Public School - Gateway, and Esperanza Academy School of Hope.
Ownership History
Date
Name
Owned For
Owner Type
Purchase Details
Closed on
Aug 30, 2002
Sold by
Escobar Pedro L and Escobar Betsy A
Bought by
Castillo Maria T
Current Estimated Value
Home Financials for this Owner
Home Financials are based on the most recent Mortgage that was taken out on this home.
Original Mortgage
$254,013
Outstanding Balance
$104,387
Interest Rate
6.55%
Mortgage Type
Purchase Money Mortgage
Estimated Equity
$630,990
Purchase Details
Closed on
Jul 31, 2000
Sold by
Frometa Fernando A and Frometa Carmen E
Bought by
Escobar Pedro L and Escobar Betsy A
Purchase Details
Closed on
Apr 2, 1996
Sold by
Distefano Nellie J
Bought by
Frometa Fernando A
Create a Home Valuation Report for This Property
The Home Valuation Report is an in-depth analysis detailing your home's value as well as a comparison with similar homes in the area
Home Values in the Area
Average Home Value in this Area
Purchase History
| Date | Buyer | Sale Price | Title Company |
|---|---|---|---|
| Castillo Maria T | $258,000 | -- | |
| Escobar Pedro L | $169,900 | -- | |
| Frometa Fernando A | $99,000 | -- |
Source: Public Records
Mortgage History
| Date | Status | Borrower | Loan Amount |
|---|---|---|---|
| Open | Frometa Fernando A | $254,013 | |
| Closed | Frometa Fernando A | $5,870 | |
| Closed | Frometa Fernando A | $60,000 |
Source: Public Records
Tax History
| Year | Tax Paid | Tax Assessment Tax Assessment Total Assessment is a certain percentage of the fair market value that is determined by local assessors to be the total taxable value of land and additions on the property. | Land | Improvement |
|---|---|---|---|---|
| 2025 | $6,732 | $765,000 | $152,600 | $612,400 |
| 2024 | $6,434 | $695,600 | $112,800 | $582,800 |
| 2023 | $6,786 | $667,900 | $110,000 | $557,900 |
| 2022 | $6,444 | $563,300 | $110,000 | $453,300 |
| 2021 | $6,268 | $510,800 | $110,000 | $400,800 |
| 2020 | $6,180 | $497,200 | $99,000 | $398,200 |
| 2019 | $5,929 | $433,400 | $88,900 | $344,500 |
| 2018 | $5,429 | $379,100 | $76,500 | $302,600 |
| 2017 | $5,148 | $335,600 | $75,600 | $260,000 |
| 2016 | $4,789 | $308,800 | $55,100 | $253,700 |
| 2015 | $4,409 | $291,600 | $55,100 | $236,500 |
Source: Public Records
Map
Nearby Homes
- 25-27 Bicknell Ave
- 14 Court St
- 5 Kendrick St
- 39 Swan Ave
- 129-131 Lexington St
- 12 Annette St
- 192 Union St
- 106 Leroy Ave
- 18 Erhardt Terrace
- 173 Jackson St
- 7 Erhardt Terrace
- 109 Ferry St
- 65 Arthur St
- 131A Lawrence St Unit 40
- 2 Leslie St
- 264 E Haverhill St Unit 2
- 7-9 Bennington St
- 37 Albion St
- 32 Josephine Ave
- 89 Newbury St Unit 89B
- 10 Custer St Unit 12
- 18 Custer St Unit 20
- 18-20 Custer St
- 11 Custer St
- 9 Custer St
- 68 Custer St
- 15 Custer St Unit 2
- 15 Custer St
- 24 Custer St
- 22 Custer St Unit 24
- 17 Custer St Unit 19
- 5 Logan St
- 7 Logan St
- 3 Logan St
- 17-19 Custer St
- 9 Logan St
- 1 Logan St
- 5 Custer St
- 20 Knox St Unit 44
- 20 Knox St Unit 42
Your Personal Tour Guide
Ask me questions while you tour the home.