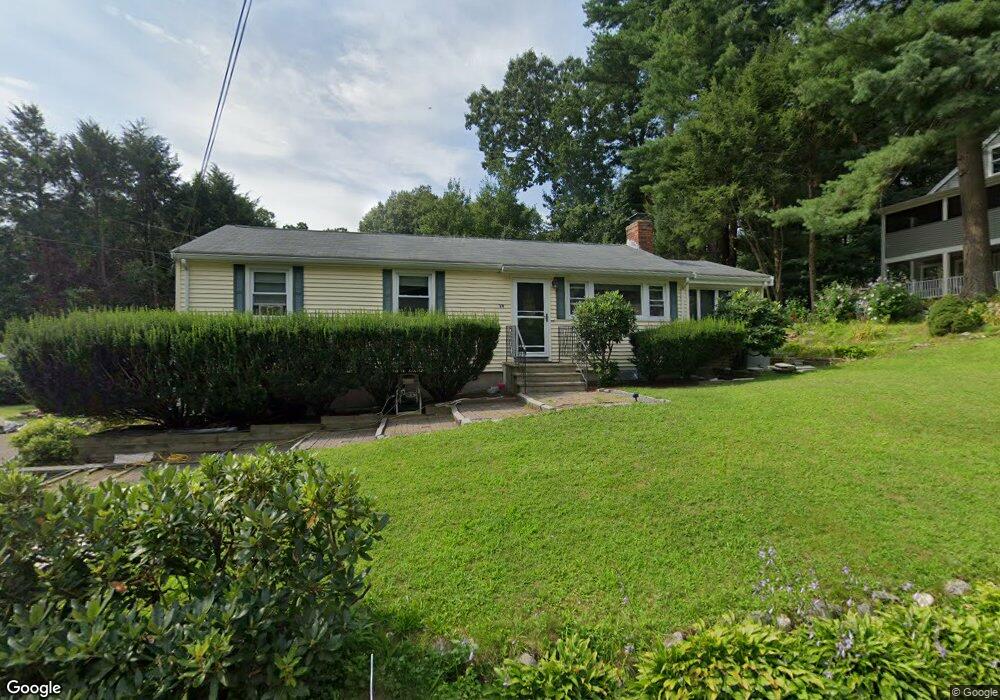
14 Cypress Rd Natick, MA 01760
Estimated Value: $727,000 - $877,000
3
Beds
3
Baths
1,243
Sq Ft
$633/Sq Ft
Est. Value
About This Home
This home is located at 14 Cypress Rd, Natick, MA 01760 and is currently estimated at $786,473, approximately $632 per square foot. 14 Cypress Rd is a home located in Middlesex County with nearby schools including Natick High School, Bennett-Hemenway (Ben-Hem) Elementary School, and Wilson Middle School.
Ownership History
Date
Name
Owned For
Owner Type
Purchase Details
Closed on
May 20, 1997
Sold by
Mahan John
Bought by
Ryder Thomas A and Ryder Rose
Current Estimated Value
Purchase Details
Closed on
Sep 12, 1996
Sold by
Mitchell Kenneth S
Bought by
Contimortgage Corp
Create a Home Valuation Report for This Property
The Home Valuation Report is an in-depth analysis detailing your home's value as well as a comparison with similar homes in the area
Home Values in the Area
Average Home Value in this Area
Purchase History
| Date | Buyer | Sale Price | Title Company |
|---|---|---|---|
| Ryder Thomas A | $162,500 | -- | |
| Contimortgage Corp | $117,000 | -- |
Source: Public Records
Mortgage History
| Date | Status | Borrower | Loan Amount |
|---|---|---|---|
| Open | Contimortgage Corp | $319,942 |
Source: Public Records
Tax History Compared to Growth
Tax History
| Year | Tax Paid | Tax Assessment Tax Assessment Total Assessment is a certain percentage of the fair market value that is determined by local assessors to be the total taxable value of land and additions on the property. | Land | Improvement |
|---|---|---|---|---|
| 2025 | $7,852 | $656,500 | $435,700 | $220,800 |
| 2024 | $7,557 | $616,400 | $410,100 | $206,300 |
| 2023 | $7,535 | $596,100 | $393,700 | $202,400 |
| 2022 | $7,301 | $547,300 | $357,000 | $190,300 |
| 2021 | $6,971 | $512,200 | $336,600 | $175,600 |
| 2020 | $6,763 | $496,900 | $321,300 | $175,600 |
| 2019 | $6,316 | $496,900 | $321,300 | $175,600 |
| 2018 | $5,425 | $415,700 | $306,000 | $109,700 |
| 2017 | $4,994 | $370,200 | $262,500 | $107,700 |
| 2016 | $4,611 | $339,800 | $241,500 | $98,300 |
| 2015 | $4,584 | $331,700 | $241,500 | $90,200 |
Source: Public Records
Map
Nearby Homes